Instrumenting Phoenix with Telemetry and LiveDashboard
By Sophie DeBenedetto | Posted 2020-04-24
The recent release of the LiveDashboard library allows us to visualize our application metrics, performance and behavior in real-time. In this post, we’ll add LiveDashboard to our Phoenix app, examine the out-of-the-box features and take a look under the hood to understand how LiveDashboard hooks into Telemetry events in order to visualize them.
The recent release of the LiveDashboard library allows us to visualize our application metrics, performance and behavior in real-time. In this post, we’ll add LiveDashboard to our Phoenix app, examine the out-of-the-box features and take a look under the hood to understand how LiveDashboard hooks into Telemetry events in order to visualize them.
The App
We’ll be working with the Phoenix app we set up for our Telemetry series of blog posts, Quantum. The Quantum app doesn’t do much–it really just exists to be measured. In this post, we’ll set up a Telemetry supervisor that implements a set of metrics definitions for Telemetry events. The metrics we’ll define match up to some out-of-the-box Telemetry events emitted by Phoenix and Ecto. For a deeper dive on Telemetry events, check out our series of posts on Instrumenting Phoenix with Telemetry. Upcoming posts in this series take a closer look at the out-of-the-box Telemetry events offered by Phoenix and Ecto, walkthrough how to add our own Telemetry events and more.
The Code
The final code for this walkthrough can be found here.
Adding LiveDashboard
First, we’ll add the LiveDashboard dependency to our Phoenix app:
# mix.exs
def deps do
  [
    {:phoenix_live_dashboard, "~> 0.1"}
  ]
end
Next up, we’ll ensure LiveView is configured:
# config/config.exs
config :quantum, QuantumWeb.Endpoint,
  live_view: [signing_salt: "SECRET_SALT"]
Then, we’ll ensure the LiveView socket is declared in our app’s Endpoint:
# lib/quantum_web/endpoint.ex
socket "/live", Phoenix.LiveView.Socket
Lastly, we’ll set up request forwarding from the /dashboard endpoint to the LiveDashboard in our router:
use MyAppWeb, :router
import Phoenix.LiveDashboard.Router

...

if Mix.env() == :dev do
  scope "/" do
    pipe_through :browser
    live_dashboard "/dashboard"
  end
end
And that’s it! If we run mix deps.get and then mix phx.server, we’ll see our LiveDashboard with its out-of-the-box monitoring visualizations.
LiveDashboard Out-Of-The-Box
Home
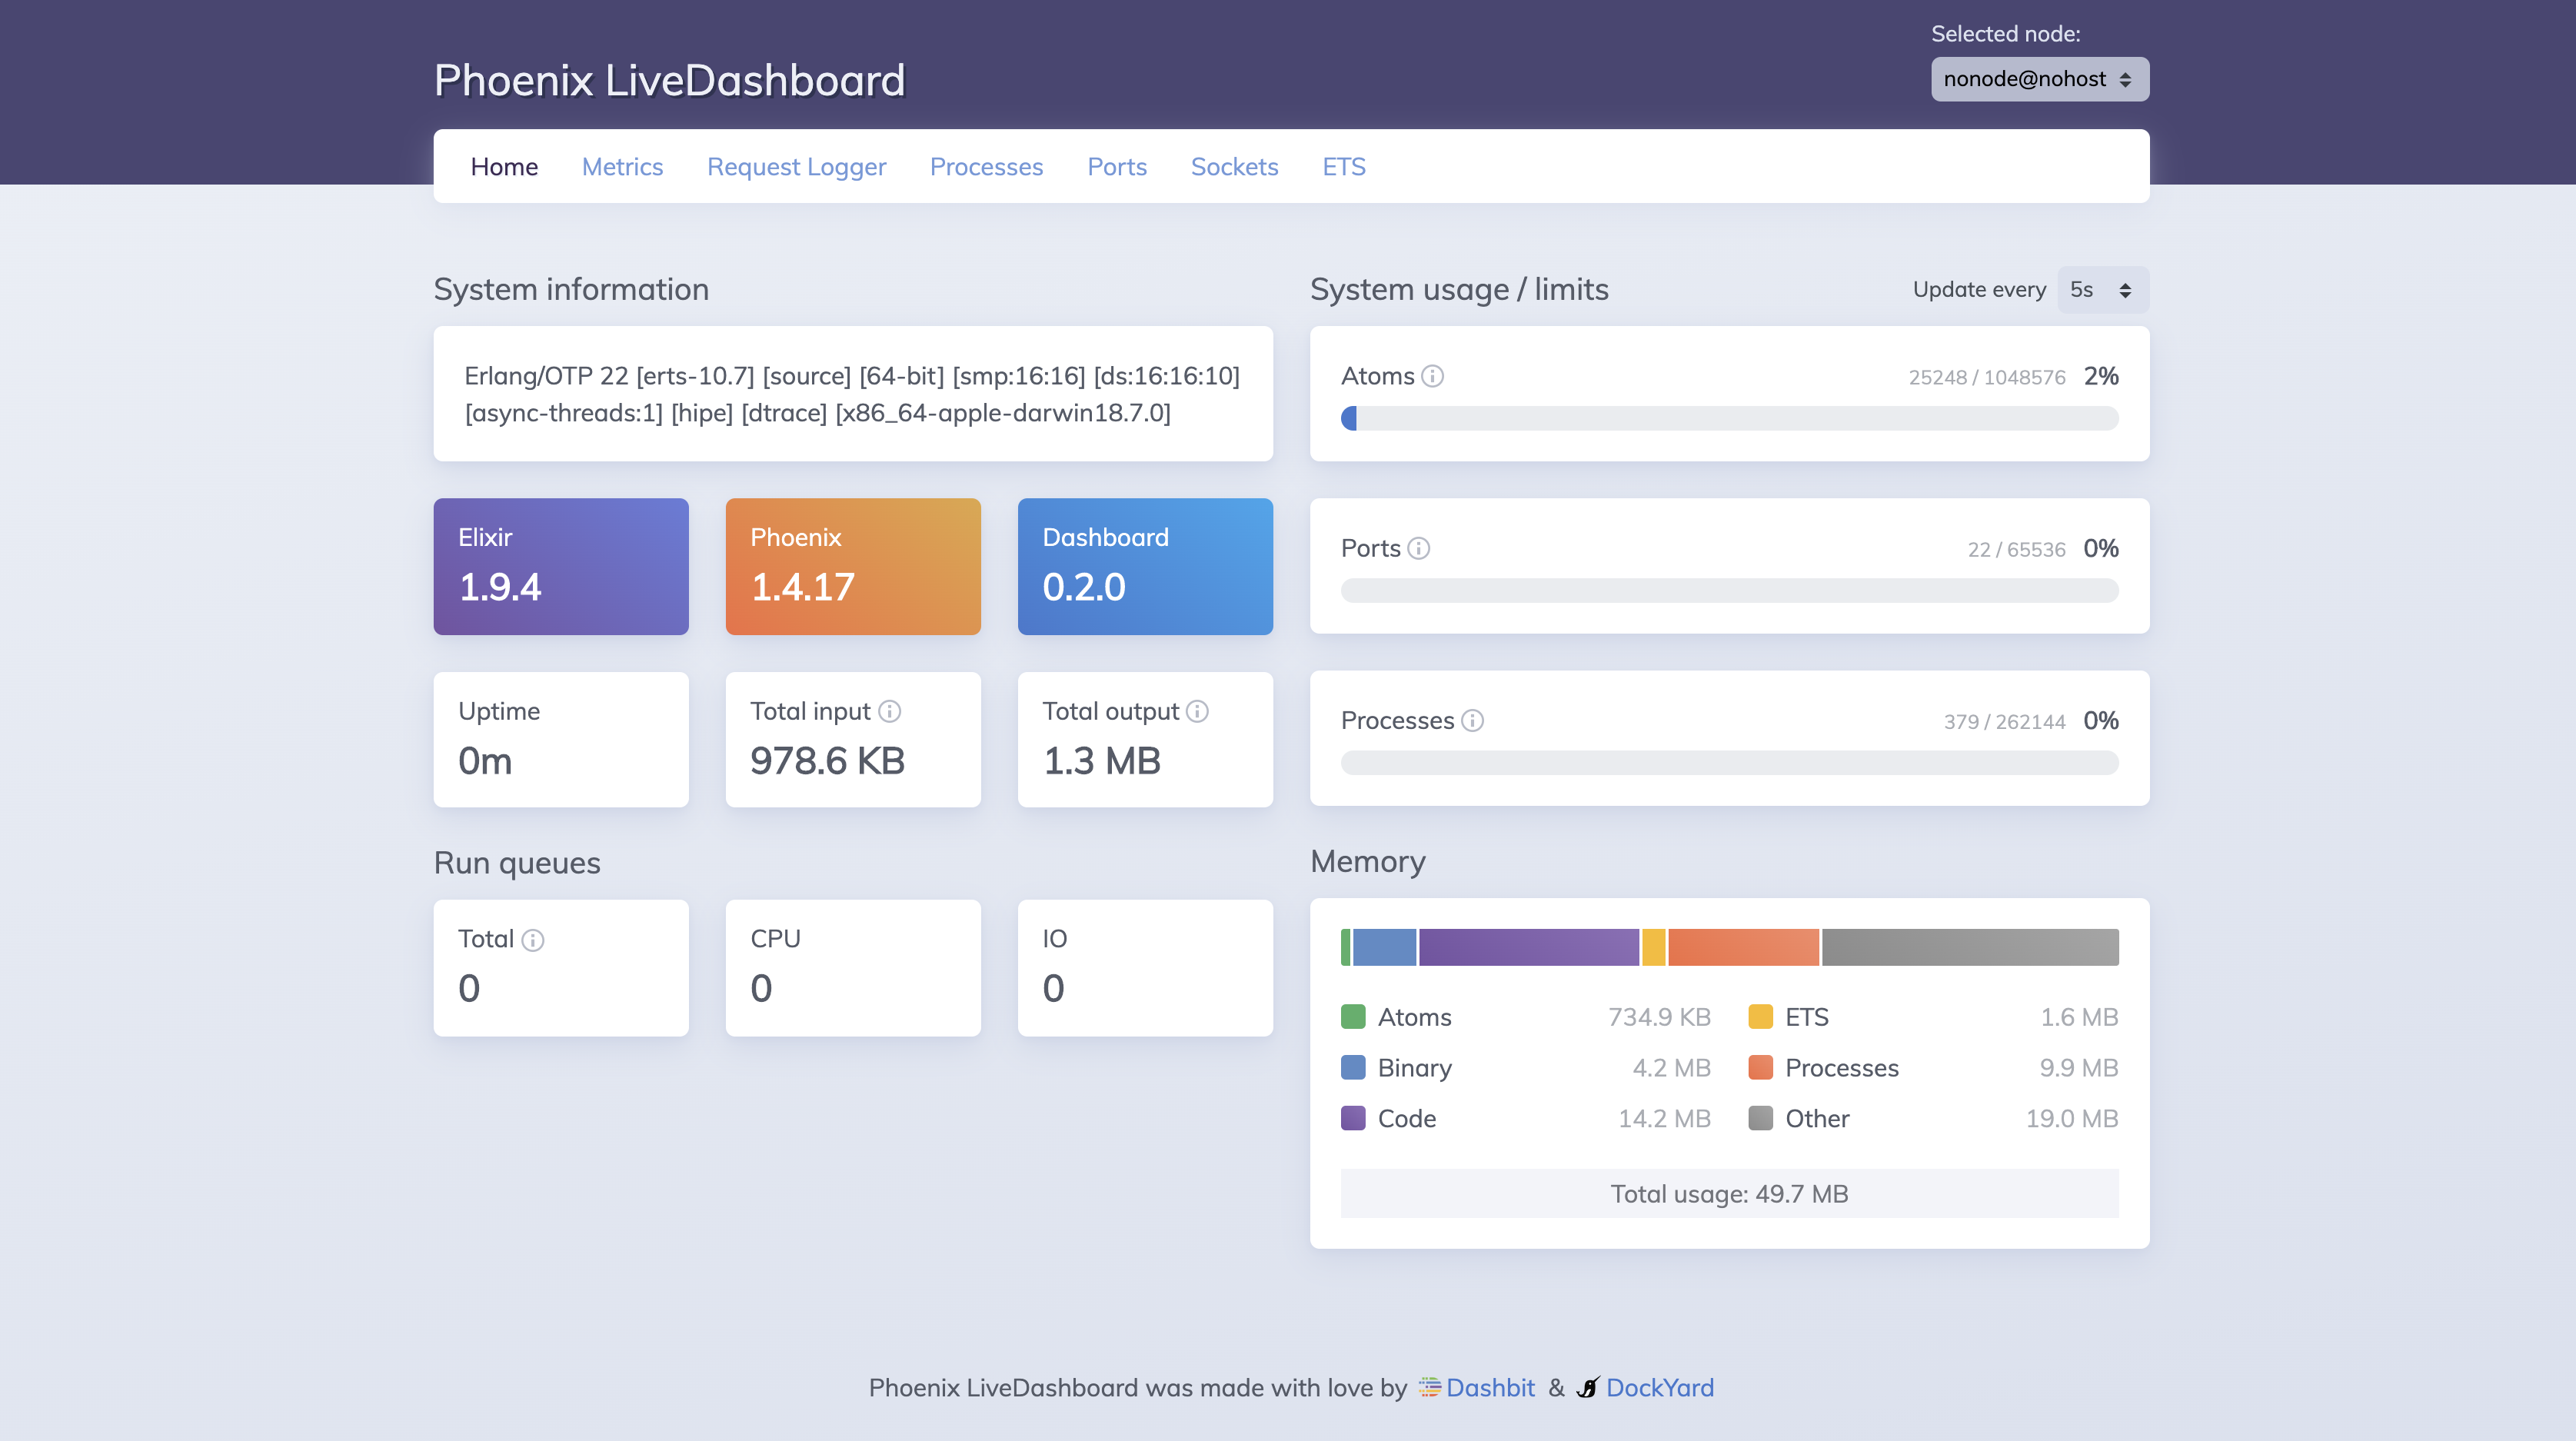
There are a number of monitoring features that LiveView displays for us out-of-the-box.
On the Home page, we can see system information like our Erlang/OTP version, Phoenix version and Elixir version. We also see some info about the number of ports, processes and atoms our app is responsible for.
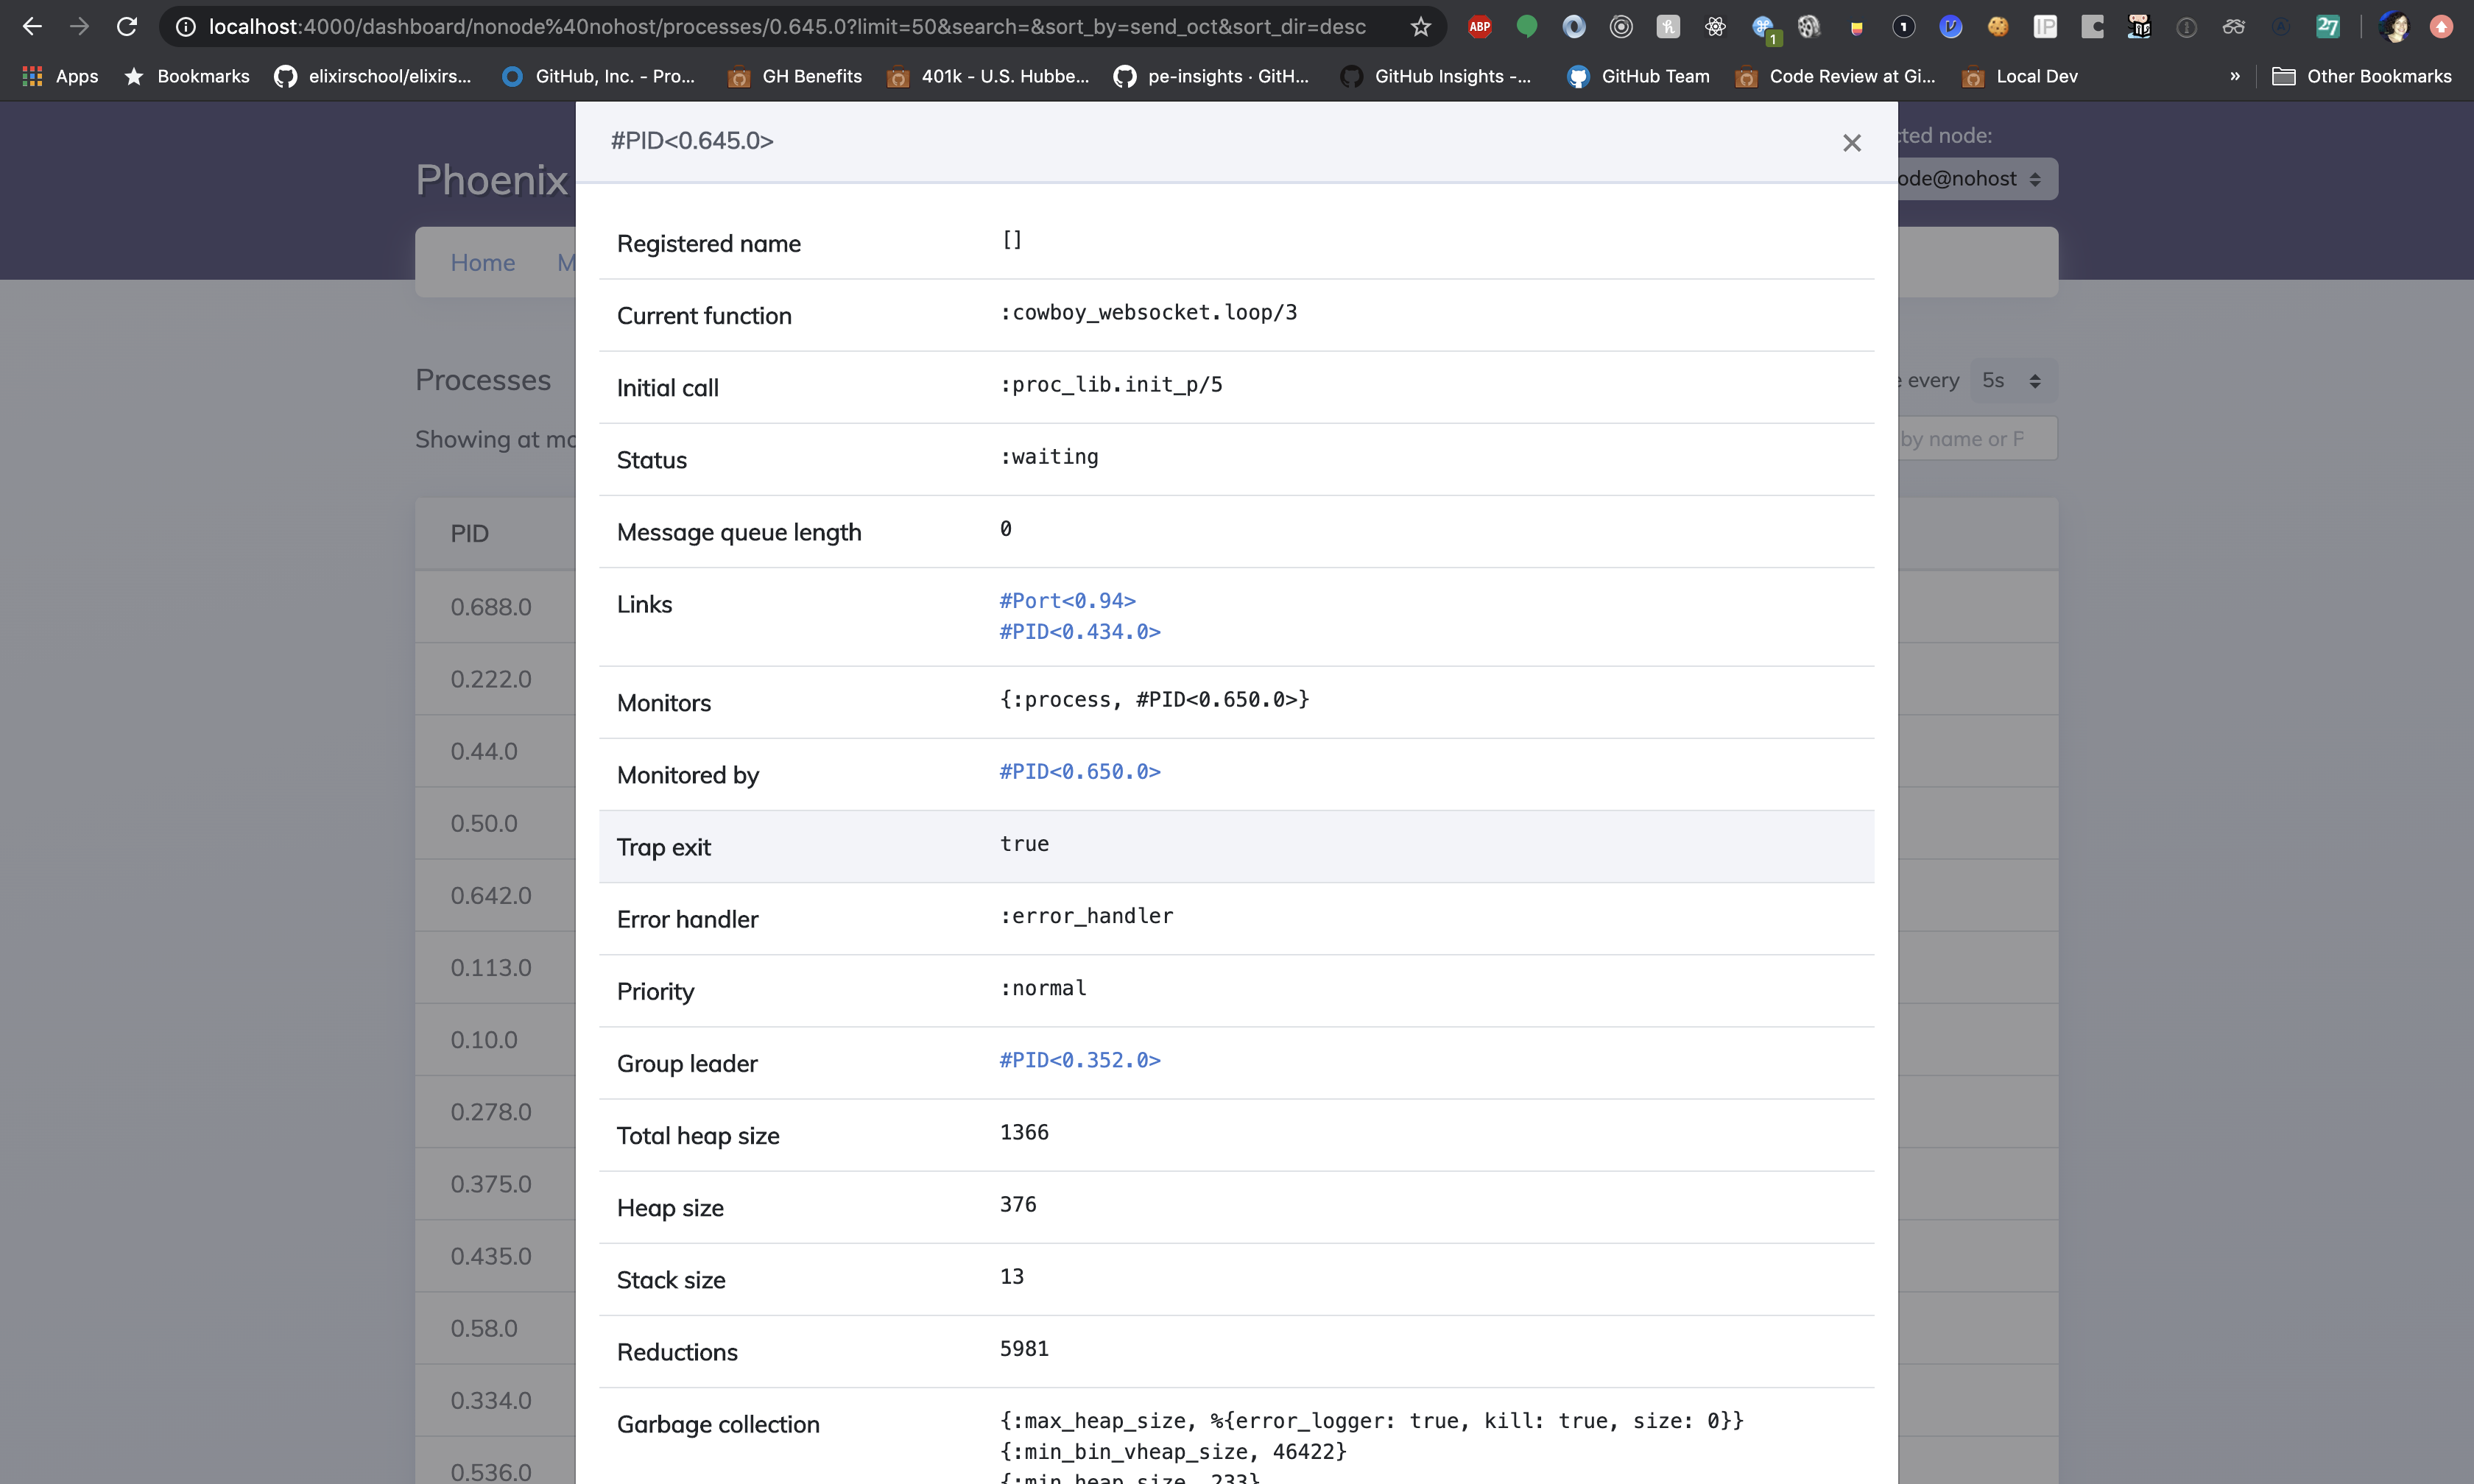
Processes
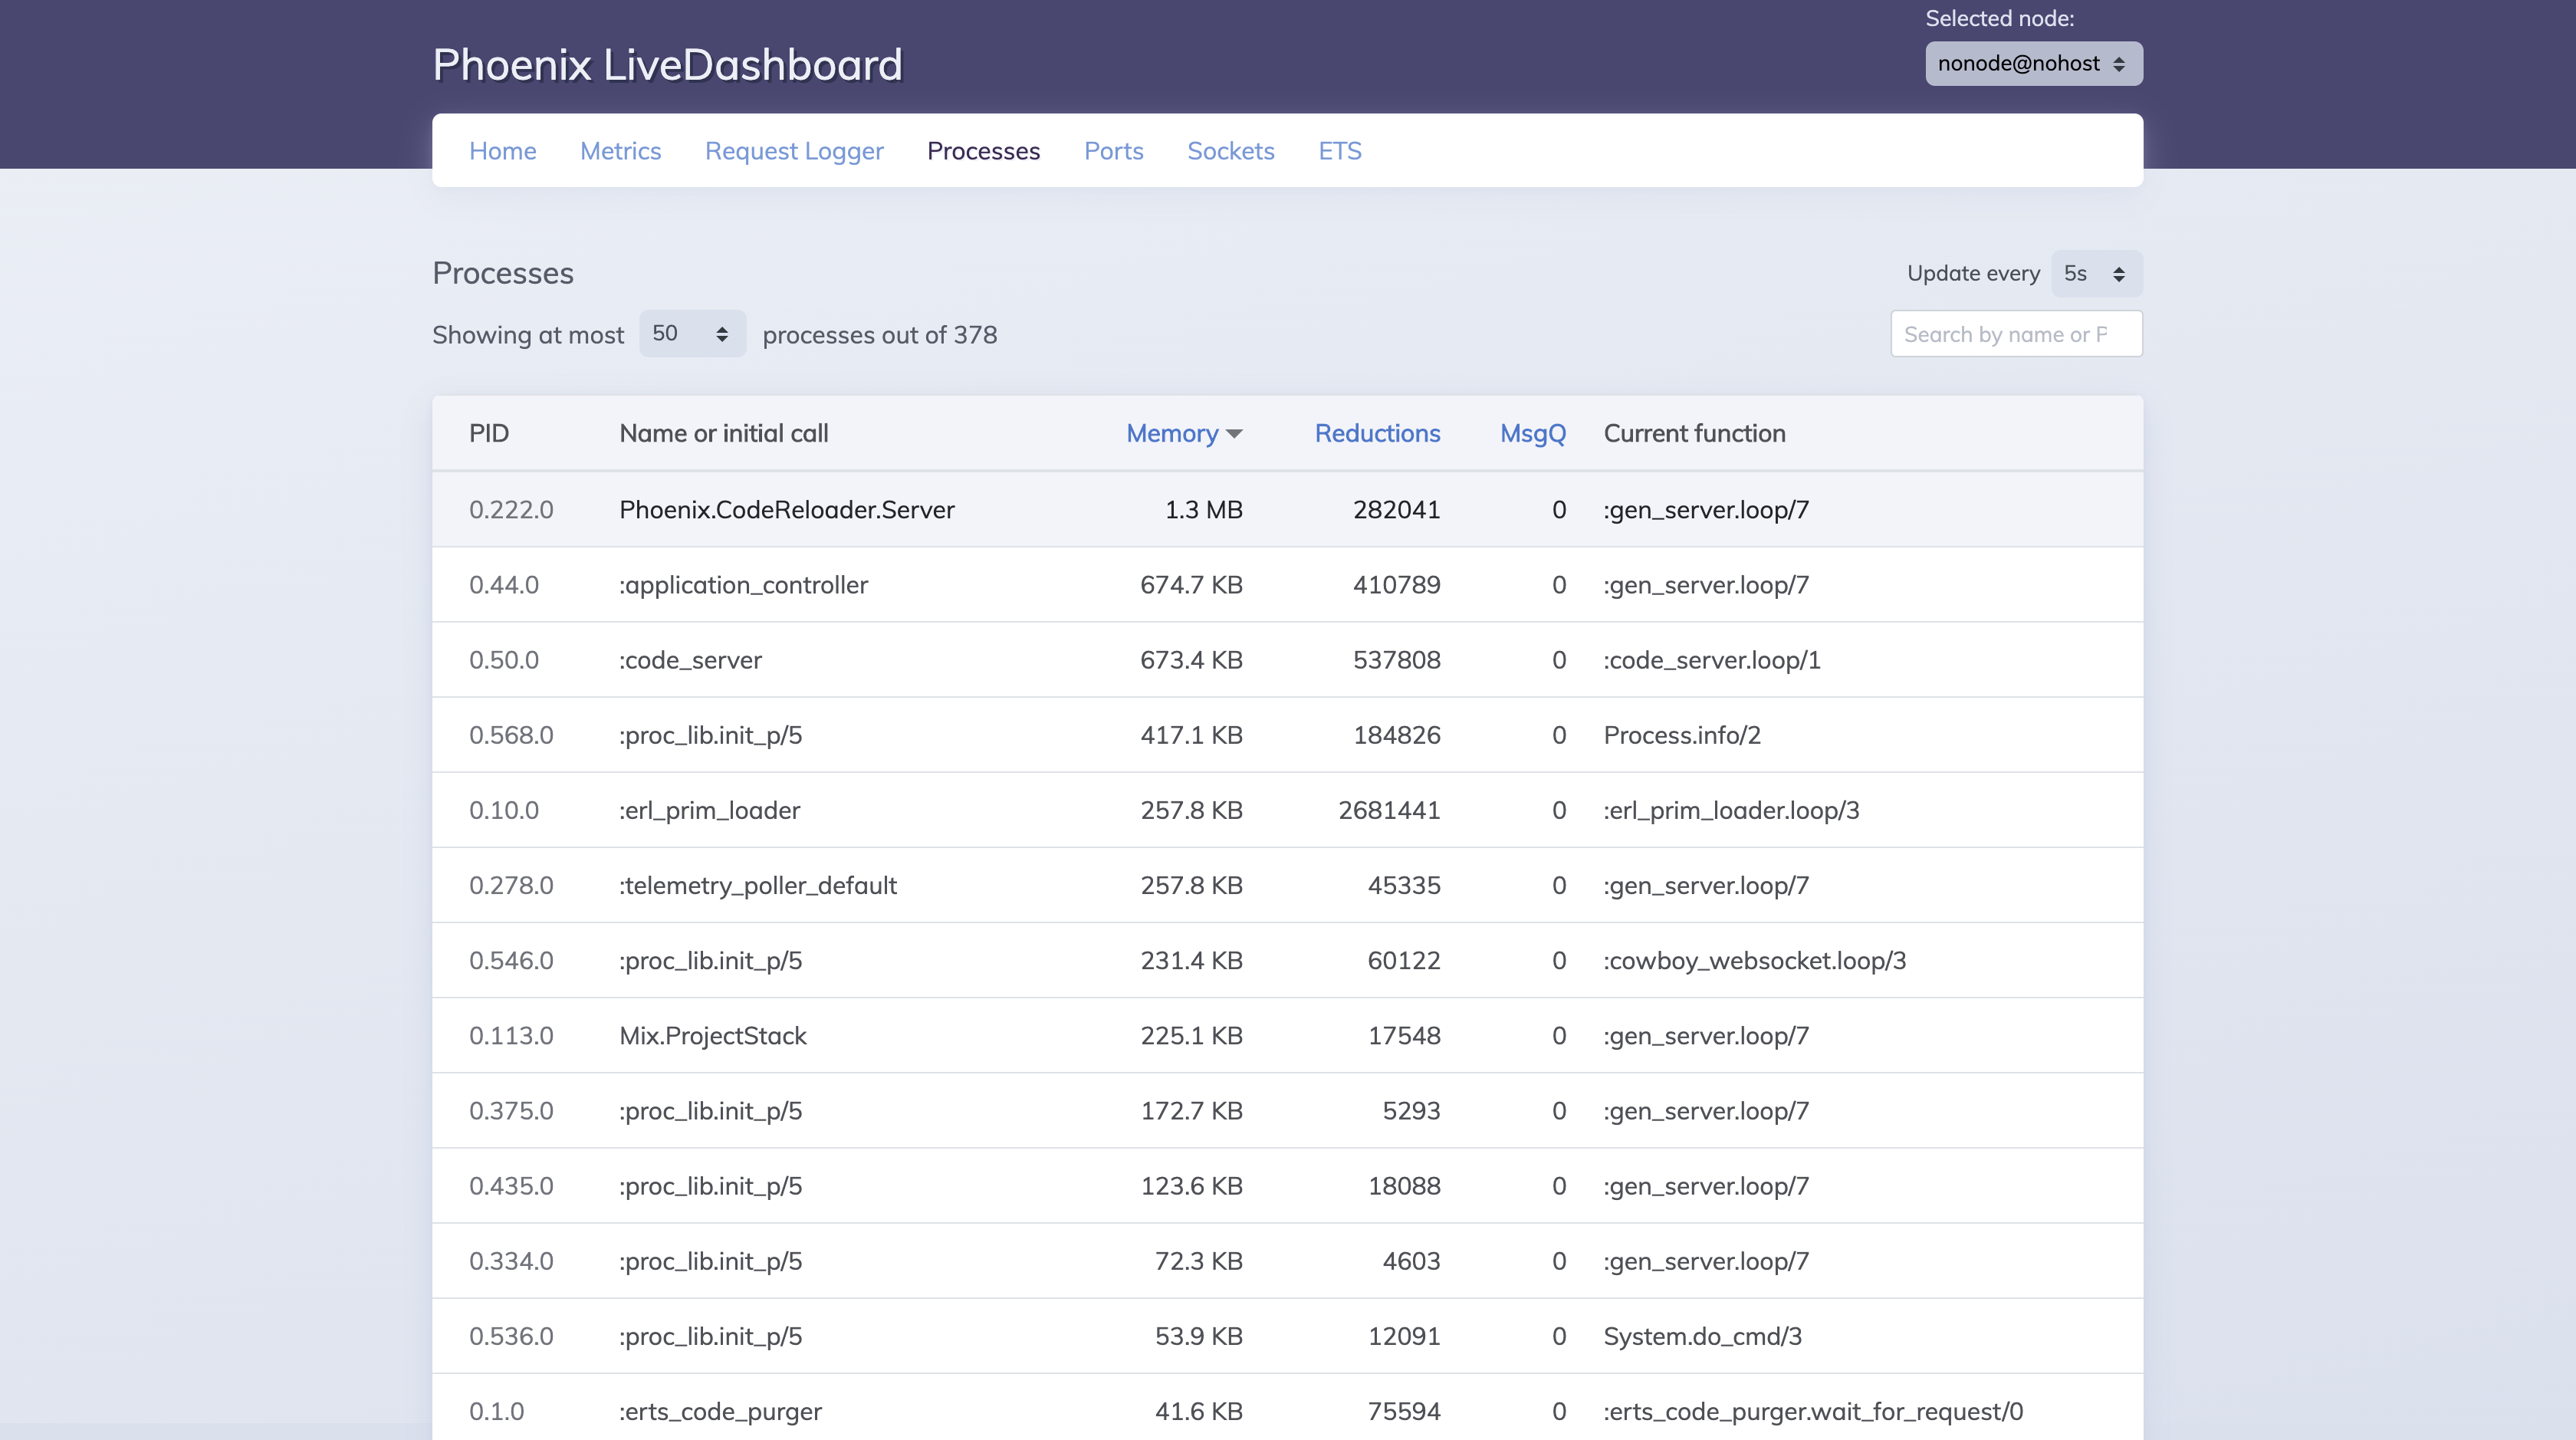
The Processes page allows us to introspect on the processes running in our app. We can see helpful info like how much memory each process account for and even which function a given process is currently executing. Inspecting a given process, we see further info including its status, initial function and stacktrace.
Ports
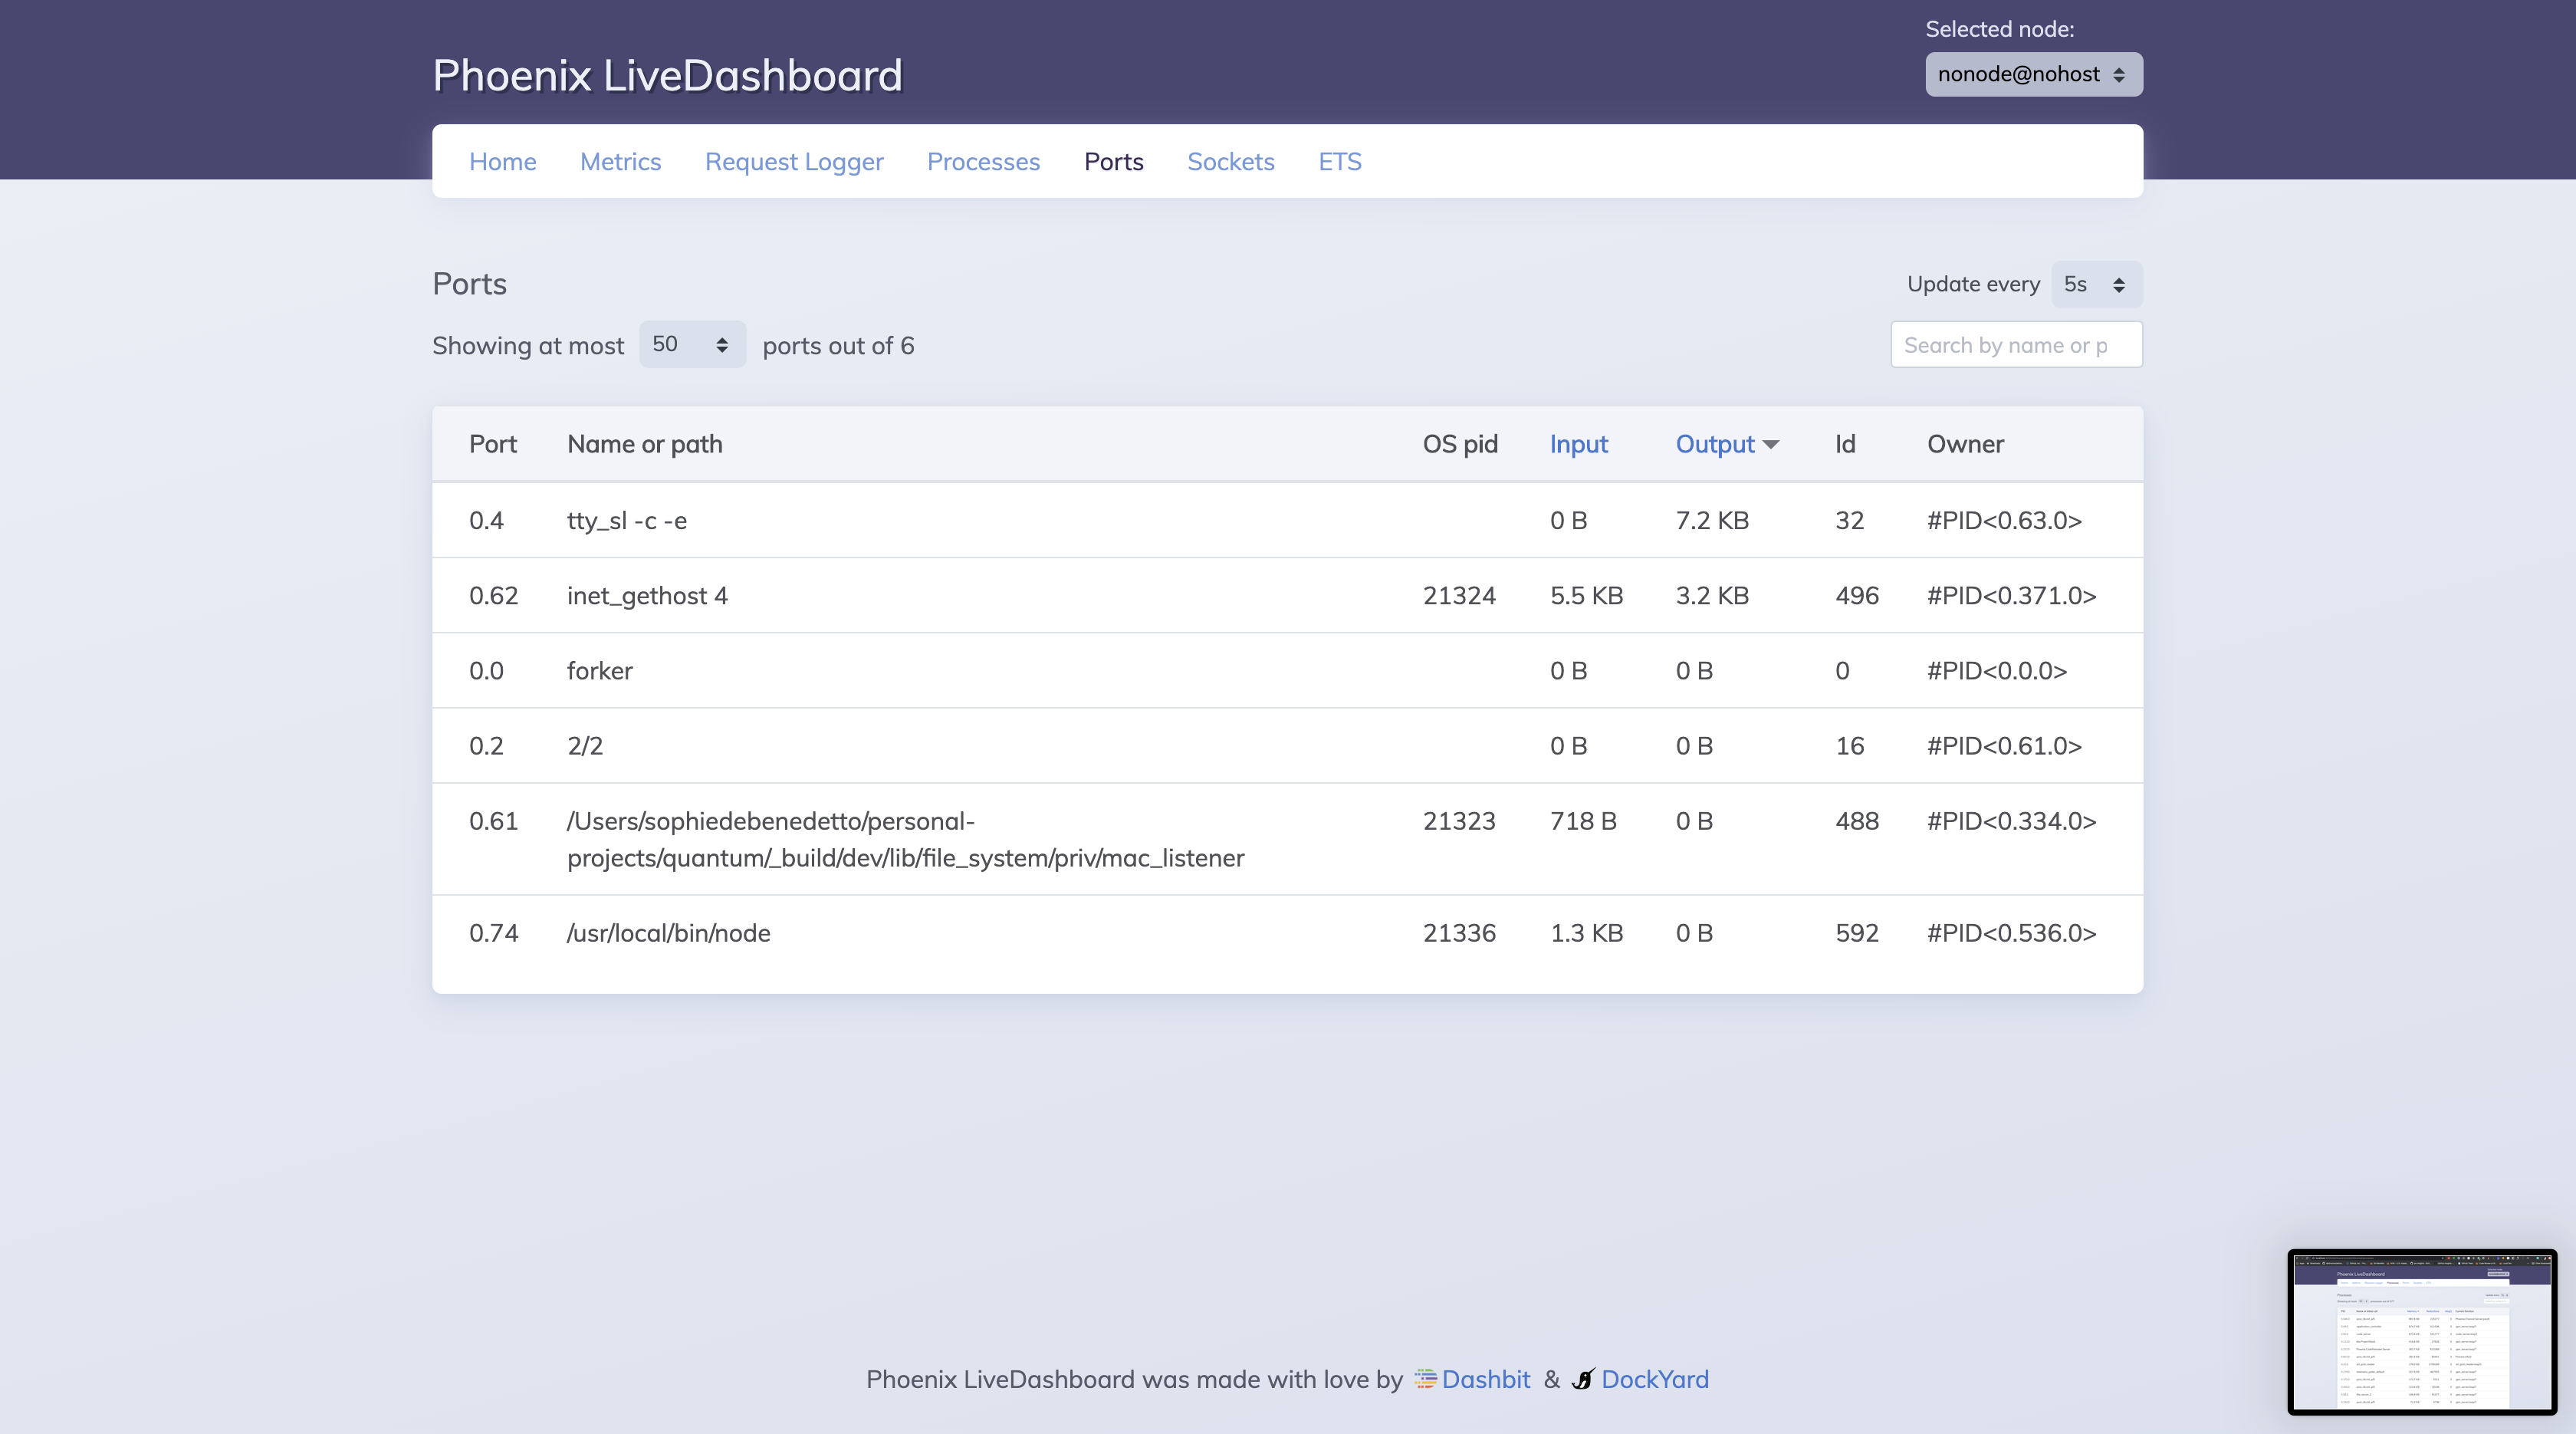
The Ports page visualizes the ports (responsible for application I/O) exposed by our application.
Inspecting a given port, we can see the which process is responsible for exposing the port and managing input/output over that port.
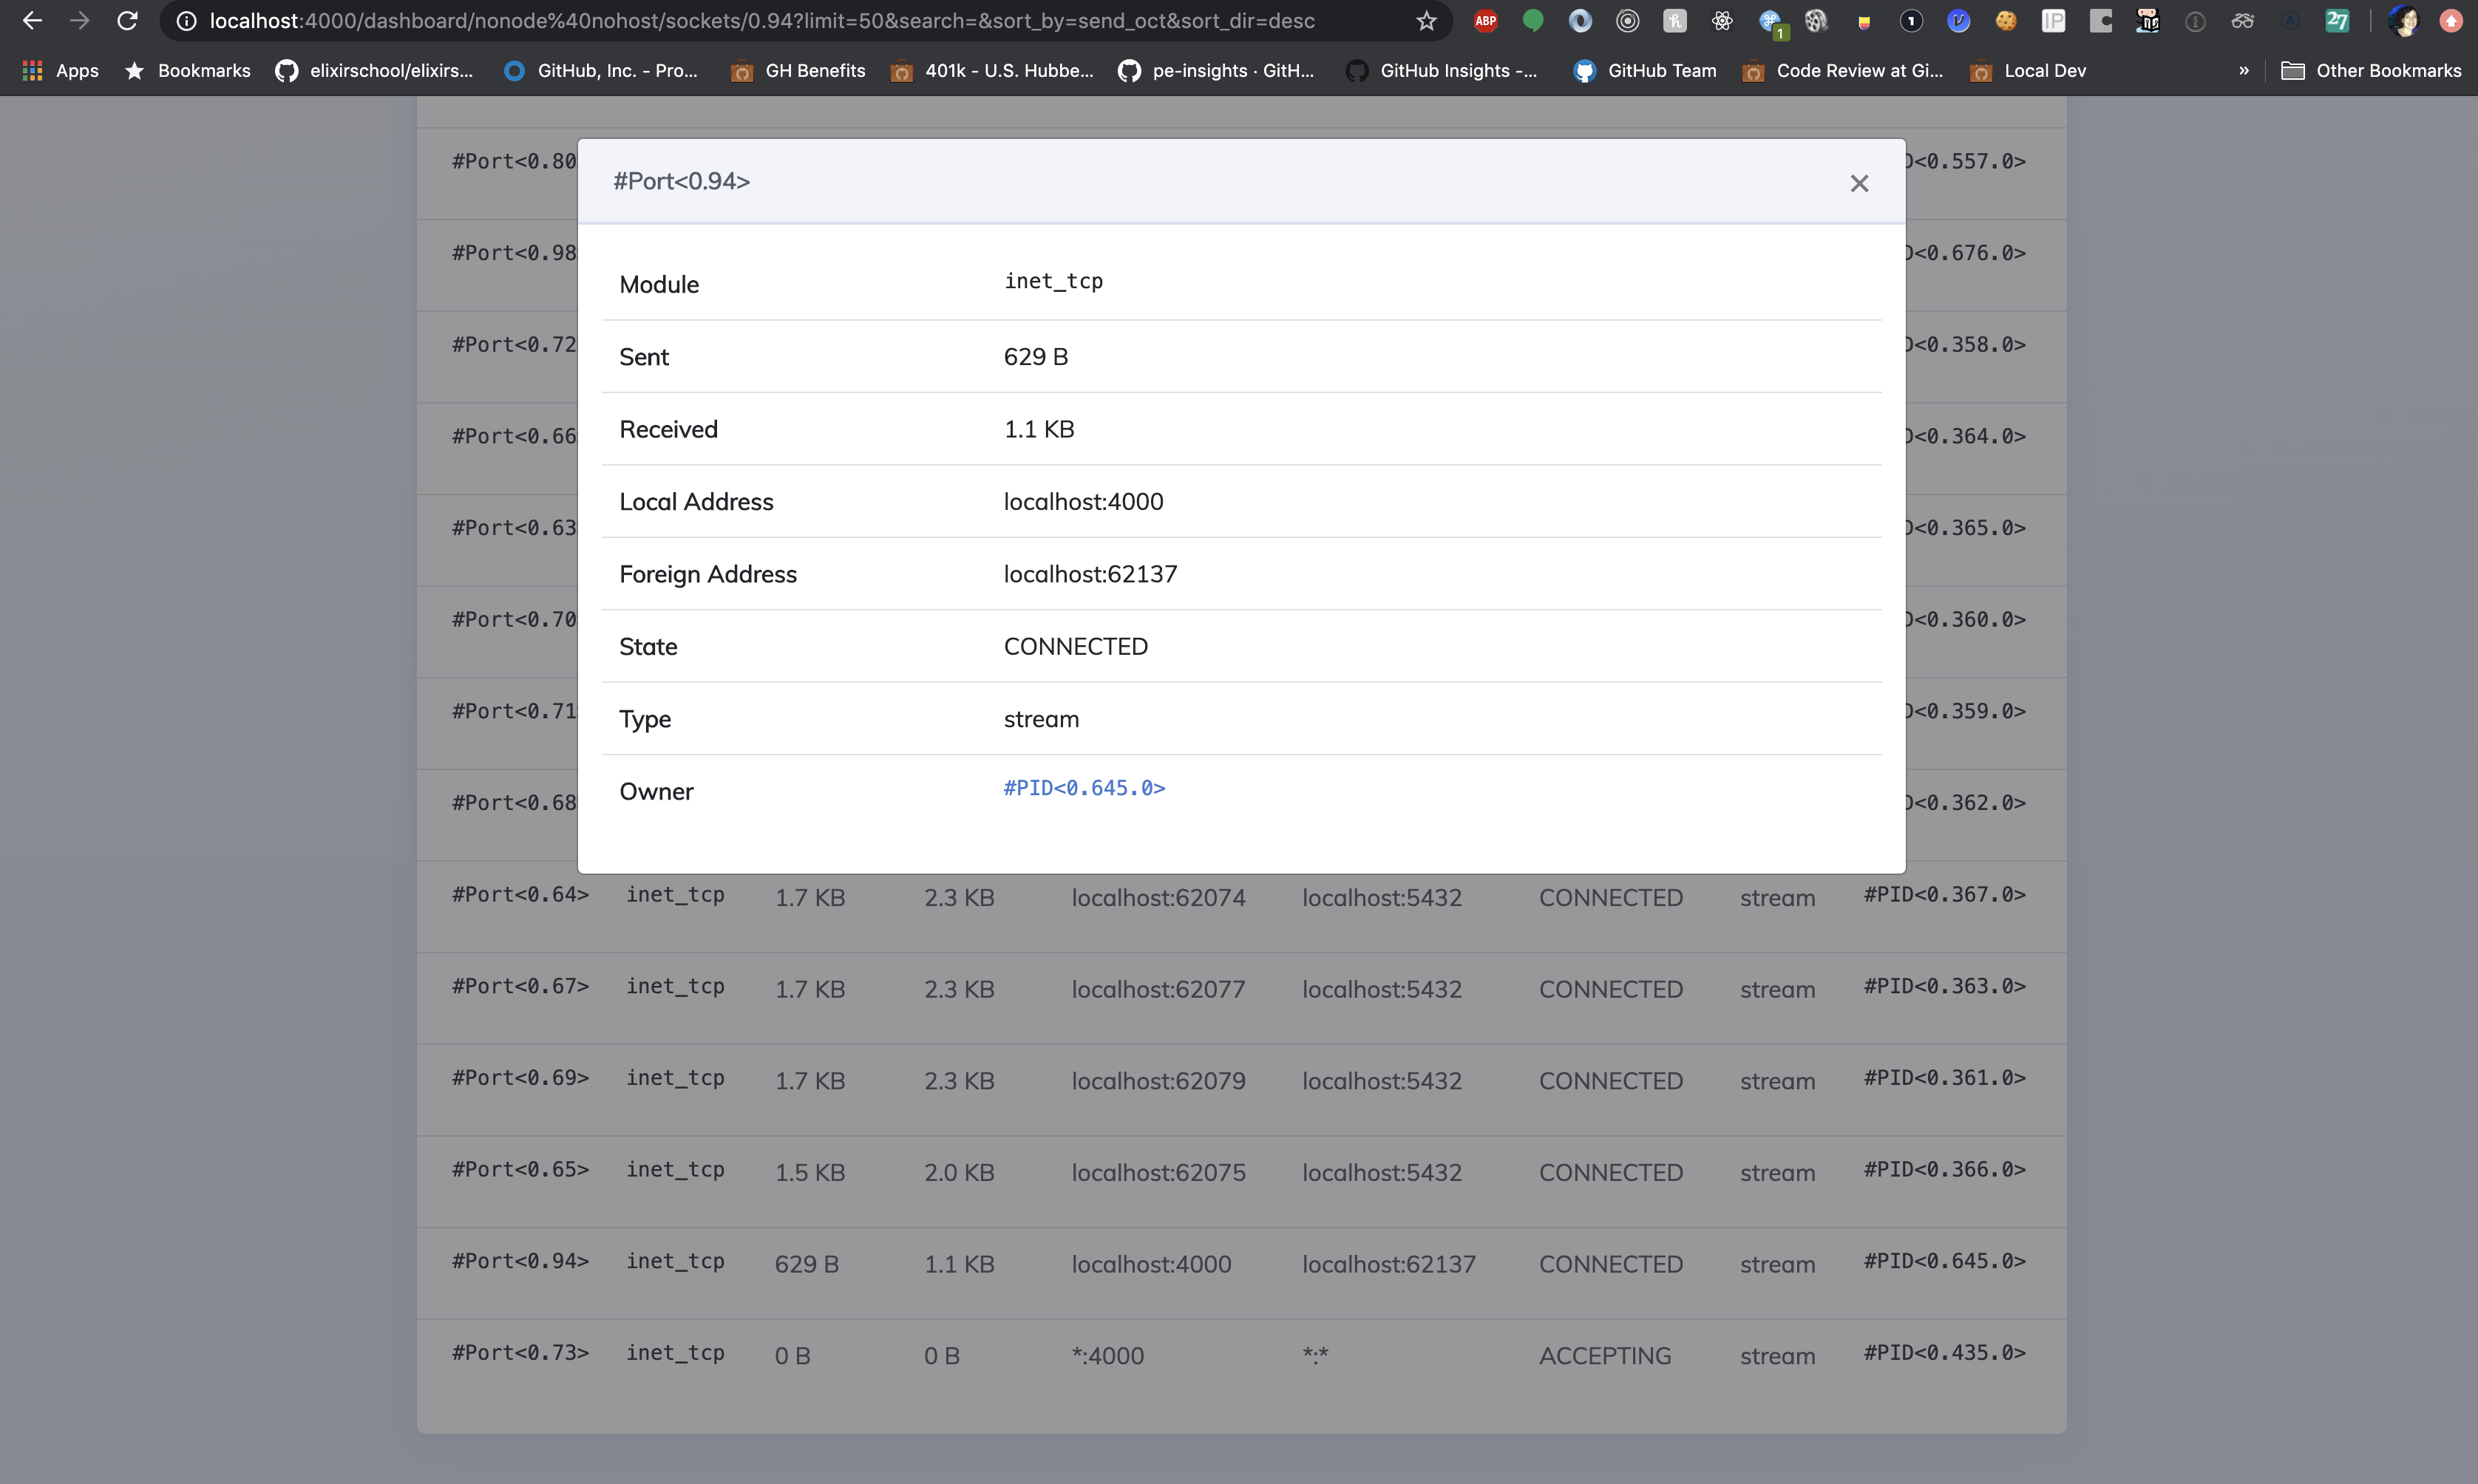
Sockets
The Sockets page exposes information about all of the sockets currently managed by the application. Sockets in our Phoenix app are responsible for all UDP/TCP traffic. Here, we even see the socket connection responsible for listening on port :4000.
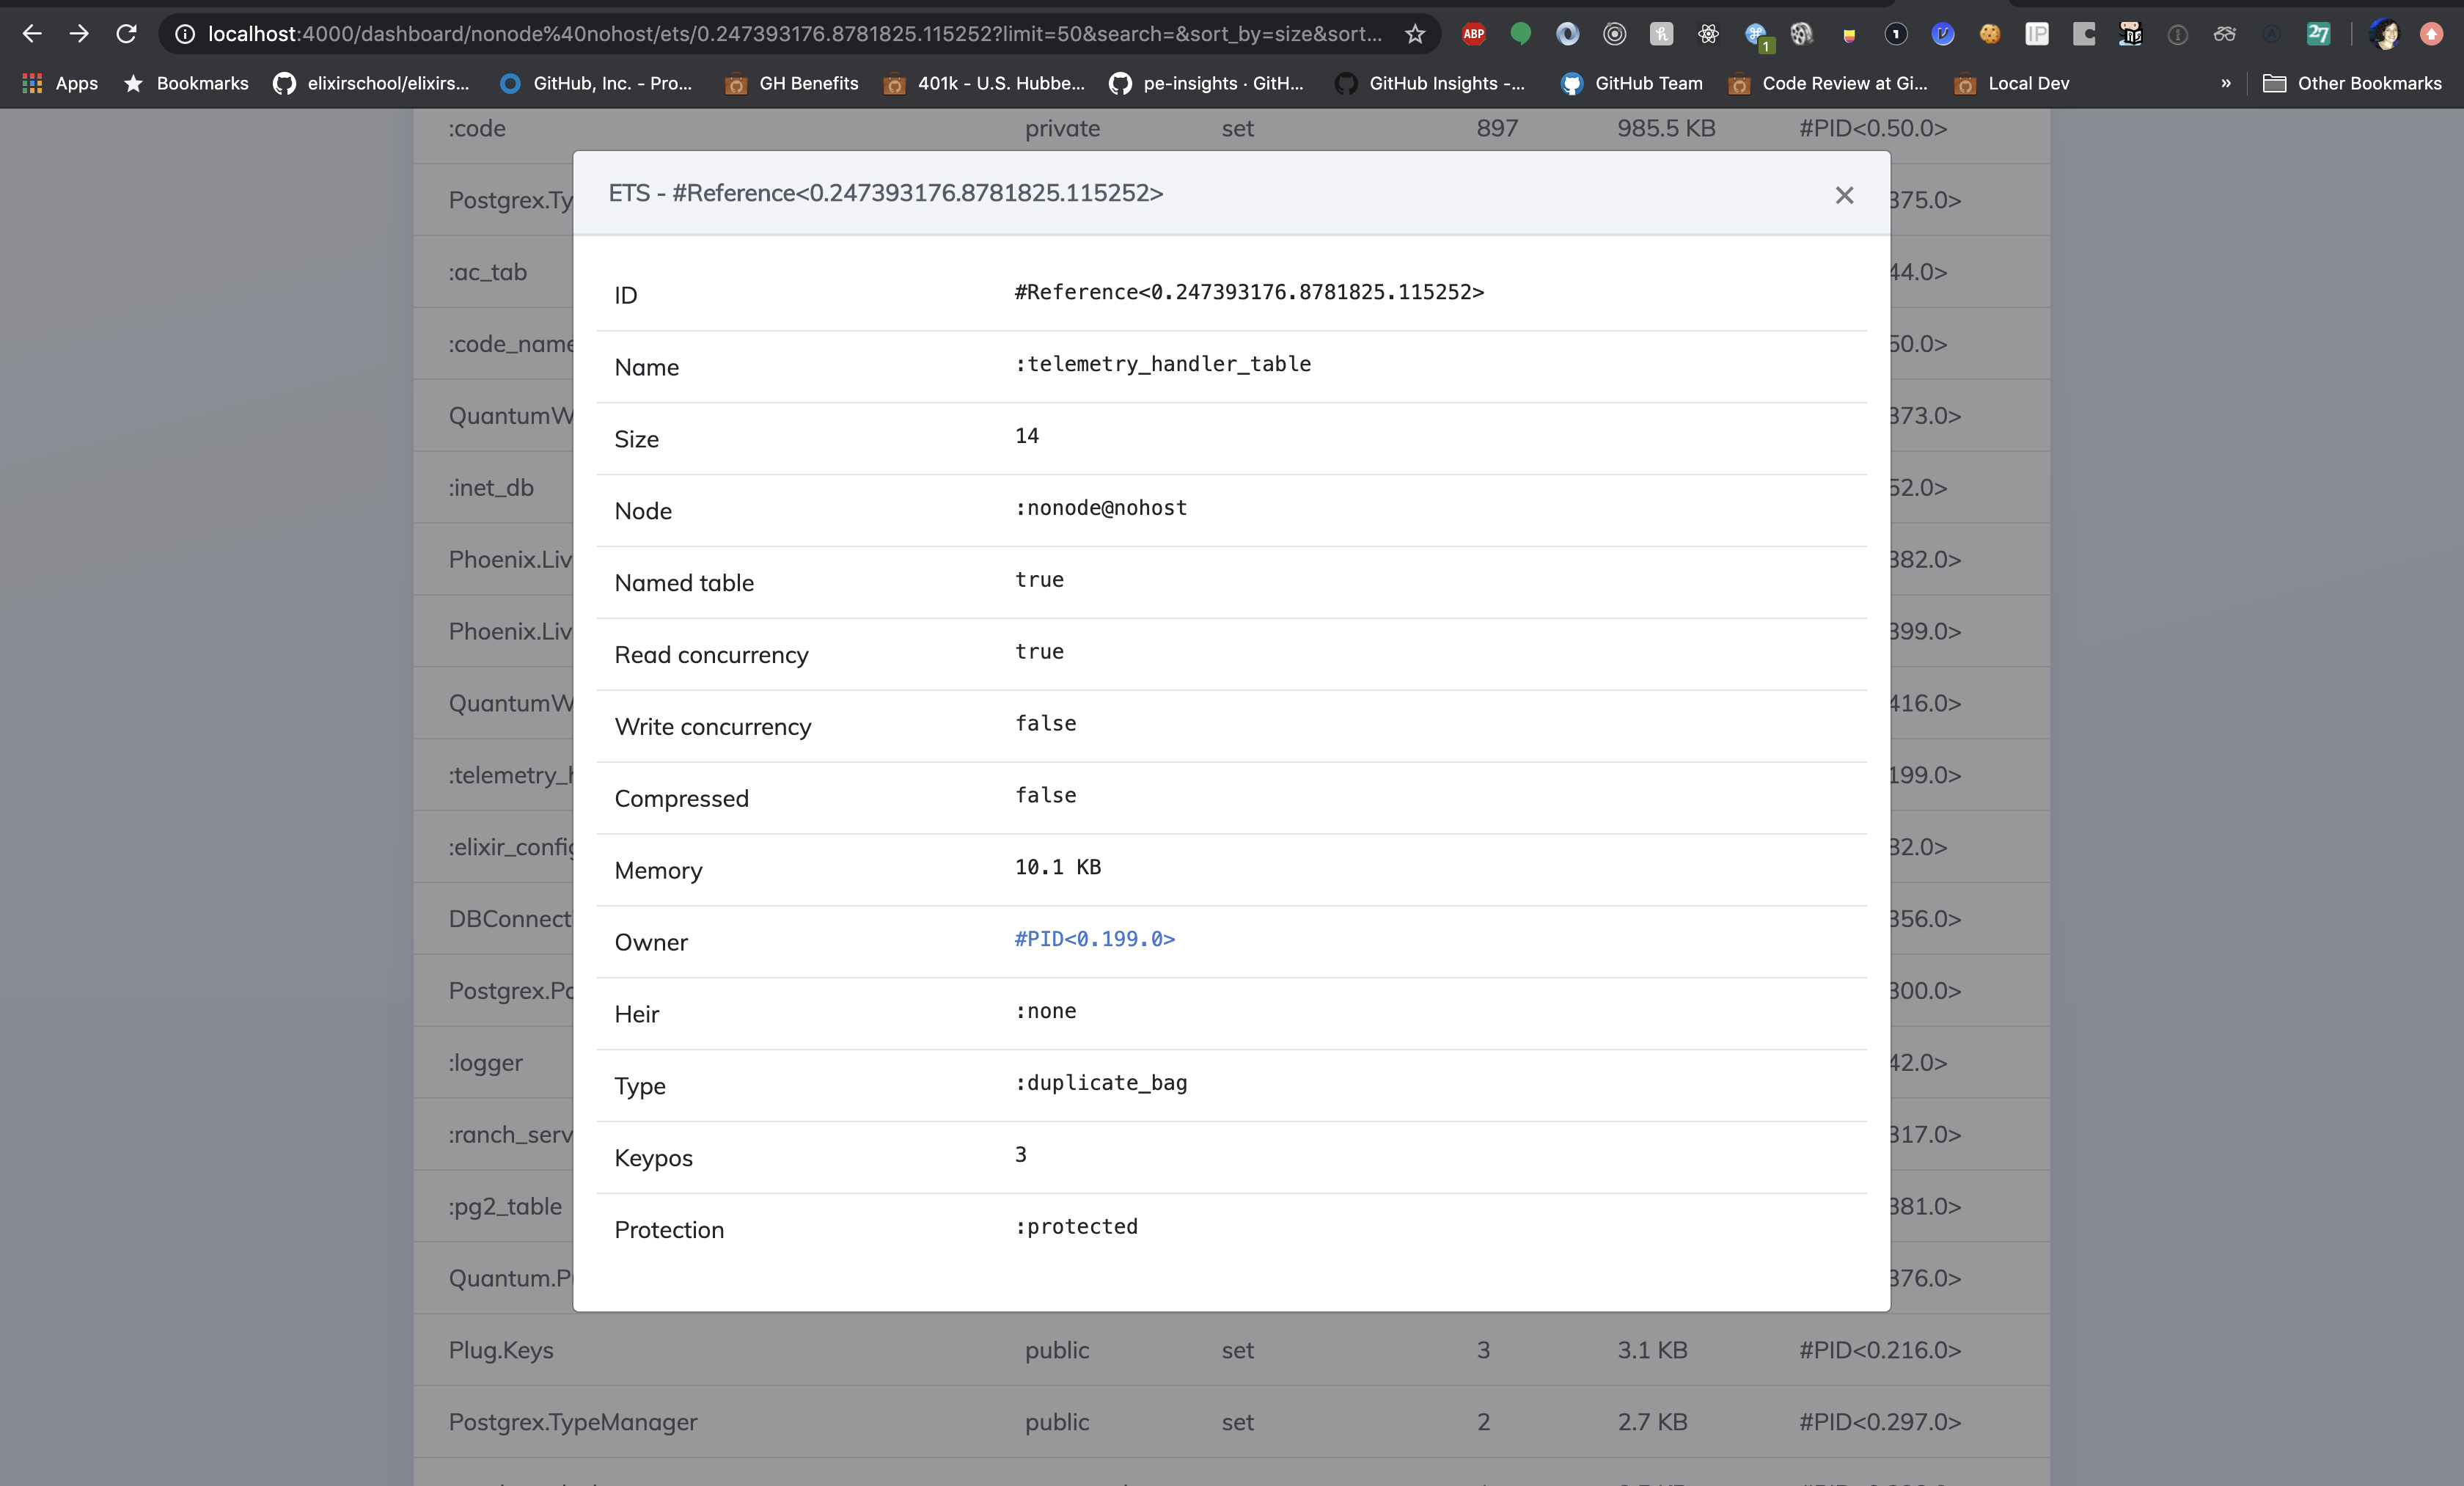
ETS
The last out-of-the-box page that the LiveDashboard offers us is the ETS page. ETS (Erlang Term Storage) is our in-memory storage. We can even se the entry for the Telemetry handler table.
LiveDashboard Metrics
Establishing Metrics
There are two LiveDashboard features that we have to do a little bit of work to enable. We’ll start with LiveDashboard Metrics, which leverages the telemetry_metrics library.
First, we’ll add telemetry_metrics to our application’s dependencies:
# mix.exs
{:telemetry_metrics, "~> 0.4"},
And run mix deps.get
The Telemetry.Metrics library provides an interface for casting Telemetry events as metrics. We’ll take a closer look at this library in a later blog post, and just focus on a high-level understanding for now.
Now that we’ve installed the library, we’re ready to define our Telemetry supervisor. The supervisor will implement a metrics/0 function that declares the set of Telemetry events that we want to handle and specifies which metrics to construct for these events.
# lib/quantum/telemetry.ex
defmodule Quantum.Telemetry do
  use Supervisor
  import Telemetry.Metrics

  def start_link(arg) do
    Supervisor.start_link(__MODULE__, arg, name: __MODULE__)
  end

  def init(_arg) do
    Supervisor.init([], strategy: :one_for_one)
  end

  def metrics do
    [
      # Erlang VM Metrics - Formats `gauge` metric type
      last_value("vm.memory.total", unit: :byte),
      last_value("vm.total_run_queue_lengths.total"),
      last_value("vm.total_run_queue_lengths.cpu"),
      last_value("vm.system_counts.process_count"),

      # Database Time Metrics - Formats `timing` metric type
      summary(
        "quantum.repo.query.total_time",
        unit: {:native, :millisecond},
        tags: [:source, :command]
      ),

      # Database Count Metrics - Formats `count` metric type
      counter(
        "quantum.repo.query.count",
        tags: [:source, :command]
      ),

      # Phoenix Time Metrics - Formats `timing` metric type
      summary(
        "phoenix.router_dispatch.stop.duration",
        unit: {:native, :millisecond}
      ),

      # Phoenix Count Metrics - Formats `count` metric type
      counter(
        "phoenix.router_dispatch.stop.count"
      ),

      counter(
        "phoenix.error_rendered.count"
      )
    ]
  end
end
Here, we’re using the Telemetry.Metrics‘s metrics functions (counter, summary and last_value) to specify which Telemetry events to treat as which kinds of metrics. Each of these functions takes in an argument of a Telemetry event, for example, quantum.repo.query.total_time. The events listed in our metrics/0 function are all executed by Phoenix or Ecto source code for us, for free.
The metrics/0 function is later passed to a LiveDashboard LiveView. LiveDashboard uses this list of Telemetry events-as-metrics to attach the appropriate handler for each event. For a refresher on how Telemetry events are executed and handled with the help of ETS, check out our intro to Telemetry blog post here.
We’ll revisit how this works in a bit. First, let’s add our new supervisor to our app’s supervision tree:
# lib/quantum/application.ex

children = [
  Quantum.Repo,
  Quantum.Telemetry,
  Quantum.Endpoint,
  ...
]
Now we’re ready to configure LiveDashboard with our newly defined metrics.
Configuring LiveDashboard Metrics
We’ll add the following option to our live_dashboard router call.
# lib/quantum_web/router.ex
live_dashboard "/dashboard", metrics: Quantum.Telemetry
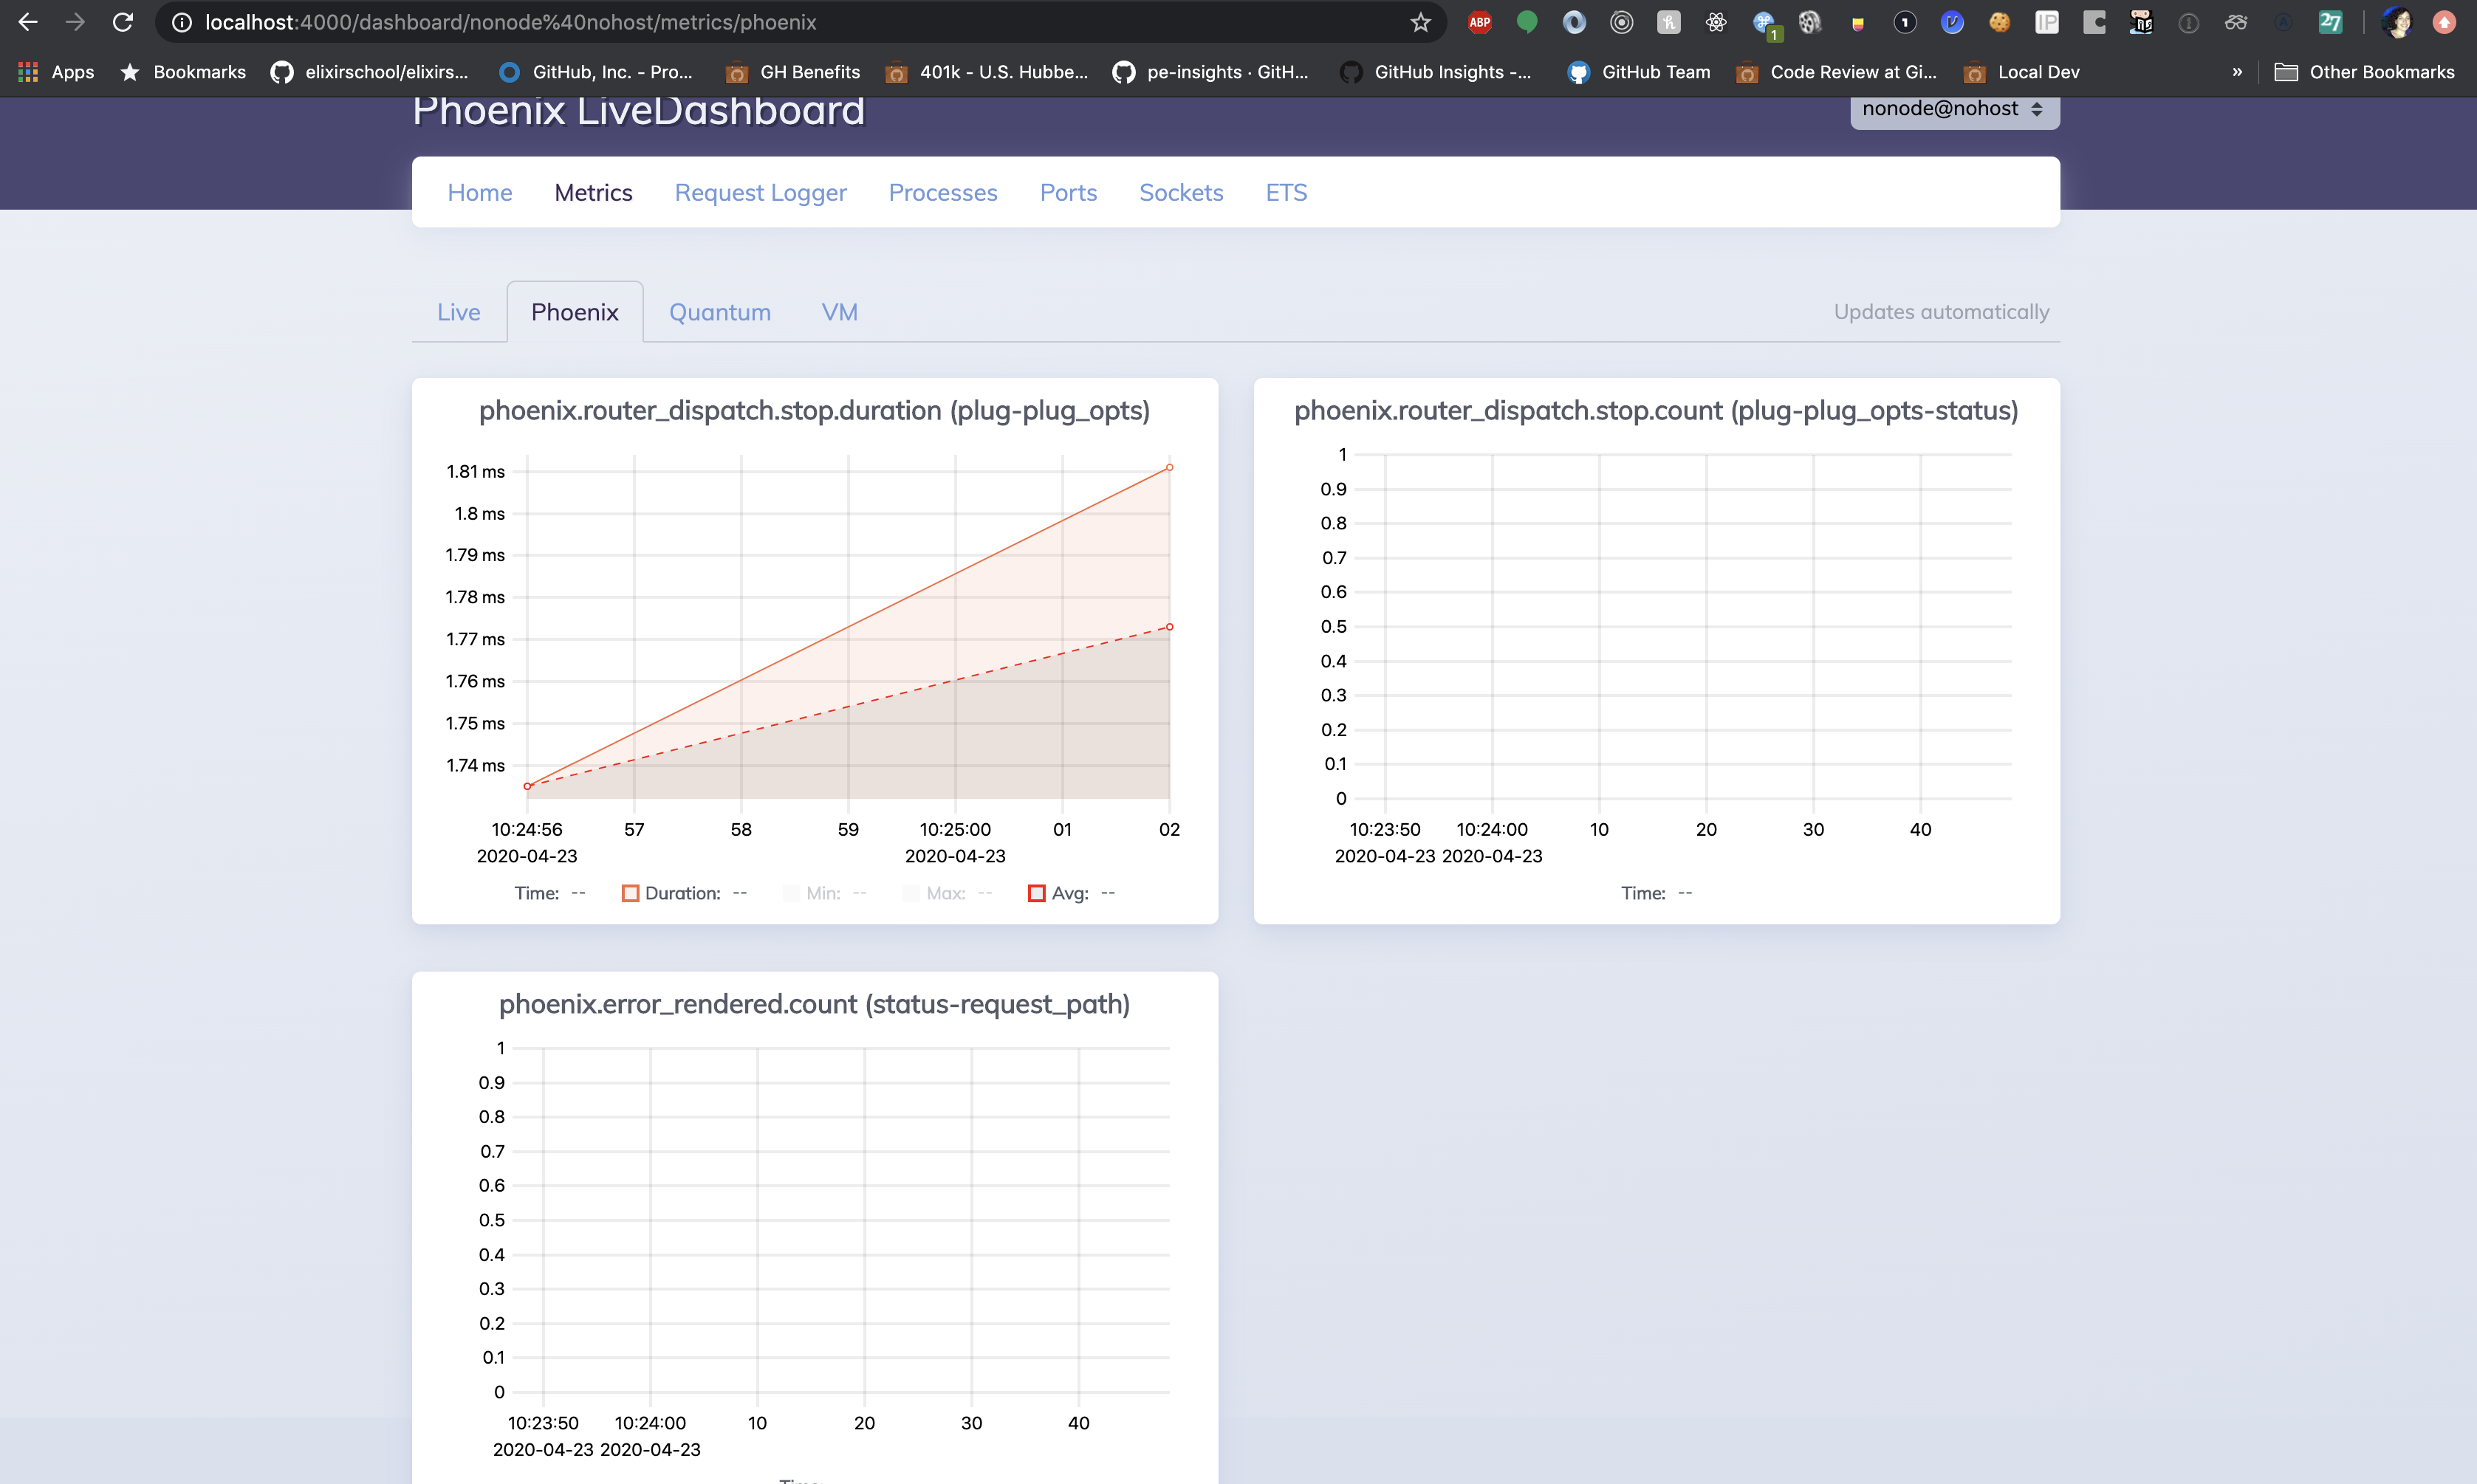
Now, if we visit /dashboard in the browser and click the Metrics tab we’ll see our metrics:
Let’s take a peek under the hood to better understand how this configuration works.
LiveDashboard Metrics Under the Hood
The live_dashboard macro contains the following line which routes live /metrics requests to the Phoenix.LiveDashboard.MetricsLive LiveView, with a session payload containing the metrics: Quantum.Telemetry options we passed in:
# live_dashboard/router.ex
live "/:node/metrics", Phoenix.LiveDashboard.MetricsLive, :metrics, opts
When the Phoenix.LiveDashboard.MetricsLive LiveView starts up, it calls on the Phoenix.LiveDashboard.TelemetryListener.listen/2 function with an argument of the metrics we defined in Quantum.Telemetry.
The Phoenix.LiveDashboard.TelemetryListener module is responsible for attaching a set of handlers to Telemetry events by storing the event/handler combos in ETS. The init/1 function of the Phoenix.LiveDashboard.TelemetryListener iterates over the metrics we defined in Quantum.Telemetry, and stores each metric’s Telemetry event name in ETS with a handler of its own handle_metrics/4 function.
# live_dashboard/telemetry_listener.ex
def init({parent, metrics}) do
  metrics = Enum.with_index(metrics, 0)
  metrics_per_event = Enum.group_by(metrics, fn {metric, _} -> metric.event_name end)

  for {event_name, metrics} <- metrics_per_event do
    id = {__MODULE__, event_name, self()}
    :telemetry.attach(id, event_name, &handle_metrics/4, {parent, metrics})
  end

  {:ok, %{ref: ref, events: Map.keys(metrics_per_event)}}
end
Recall from our earlier post on Telemetry that the :telemetry.attach/4 function stores entries in ETS that map the Telemetry event to the handler. Later, when the given Telemetry event is executed (for example, when Ecto source code executes the "quantum.repo.query.total_time" event), Telemetry will look up the event with this name in ETS and call the stored handler function, in this case Phoenix.LiveDashboard.TelemetryListener.handle_metrics/4
Taking a look at the Phoenix.LiveDashboard.TelemetryListener.handle_metrics/4 function, we can see that it does some work to format the metric for the event and then sends a message to its parent–the Phoenix.LiveDashboard.MetricsLive LiveView.
# live_dashboard/telemetry_listener.ex
def handle_metrics(_event_name, measurements, metadata, {parent, metrics}) do
  time = System.system_time(:second)

  entries =
    for {metric, index} <- metrics do
      if measurement = extract_measurement(metric, measurements) do
        label = tags_to_label(metric, metadata)
        {index, label, measurement, time}
      end
    end

  send(parent, {:telemetry, entries})
end
The Phoenix.LiveDashboard.MetricsLive LiveView implements a handle_info/2 for this {:telemetry, entries} event and responds by updating the ChartComponent, resulting in a UI update.
# live_dashboard/live/metrics_live.ex
def handle_info({:telemetry, entries}, socket) do
  for {id, label, measurement, time} <- entries do
    data = [{label, measurement, time}]
    send_update(ChartComponent, id: id, data: data)
  end

  {:noreply, socket}
end
Putting It All Together
Let’s review how all of these moving parts connect.
-
We define a Telemetry supervisor,
Quantum.Telemetry, that implements ametrics/0function. This function is responsible for mapping a set of Telemetry events to various types of metrics. -
We pass our Telemetry supervisor,
Quantum.Telemetry, as an option to our LiveDashboard in the router. -
LiveDashboard starts up a LiveView,
Phoenix.LiveDashboard.MetricsLive, with the metrics we defined inQuantum.Telemetry. -
Phoenix.LiveDashboard.MetricsLivecalls onPhoenix.LiveDashboard.TelemetryListenerwhich stores the Telemetry events-as-metrics we defined inQuantum.Telemetryin ETS with its ownhandle_metrics/4handler function. -
Later, when one of these Telemetry events is executed, Telemetry calls the stored handler function,
Phoenix.LiveDashboard.TelemetryListener.handle_metrics/4. -
The
handle_metrics/4function formats the event as the specified metric and sends a message to thePhoenix.LiveDashboard.MetricsLiveLiveView which then updates the UI!
This process if pretty cool, but there’s a lot to unpack here. For a deeper dive on how Telemetry events are stored in ETS, executed and handled, check out this post.
LiveDashboard Request Logging
The last LiveDashboard feature that we’ll set up is RequestLogger. This LiveDashboard features allows us to log all incoming requests in LiveDashboard.
Adding RequestLogger
All we need to do to get this up and running is add the following to our app’s Endpoint module, right before Plug.RequestId:
# lib/quantum_web/endpoint.ex
plug Phoenix.LiveDashboard.RequestLogger,
  param_key: "request_logger",
  cookie_key: "request_logger"
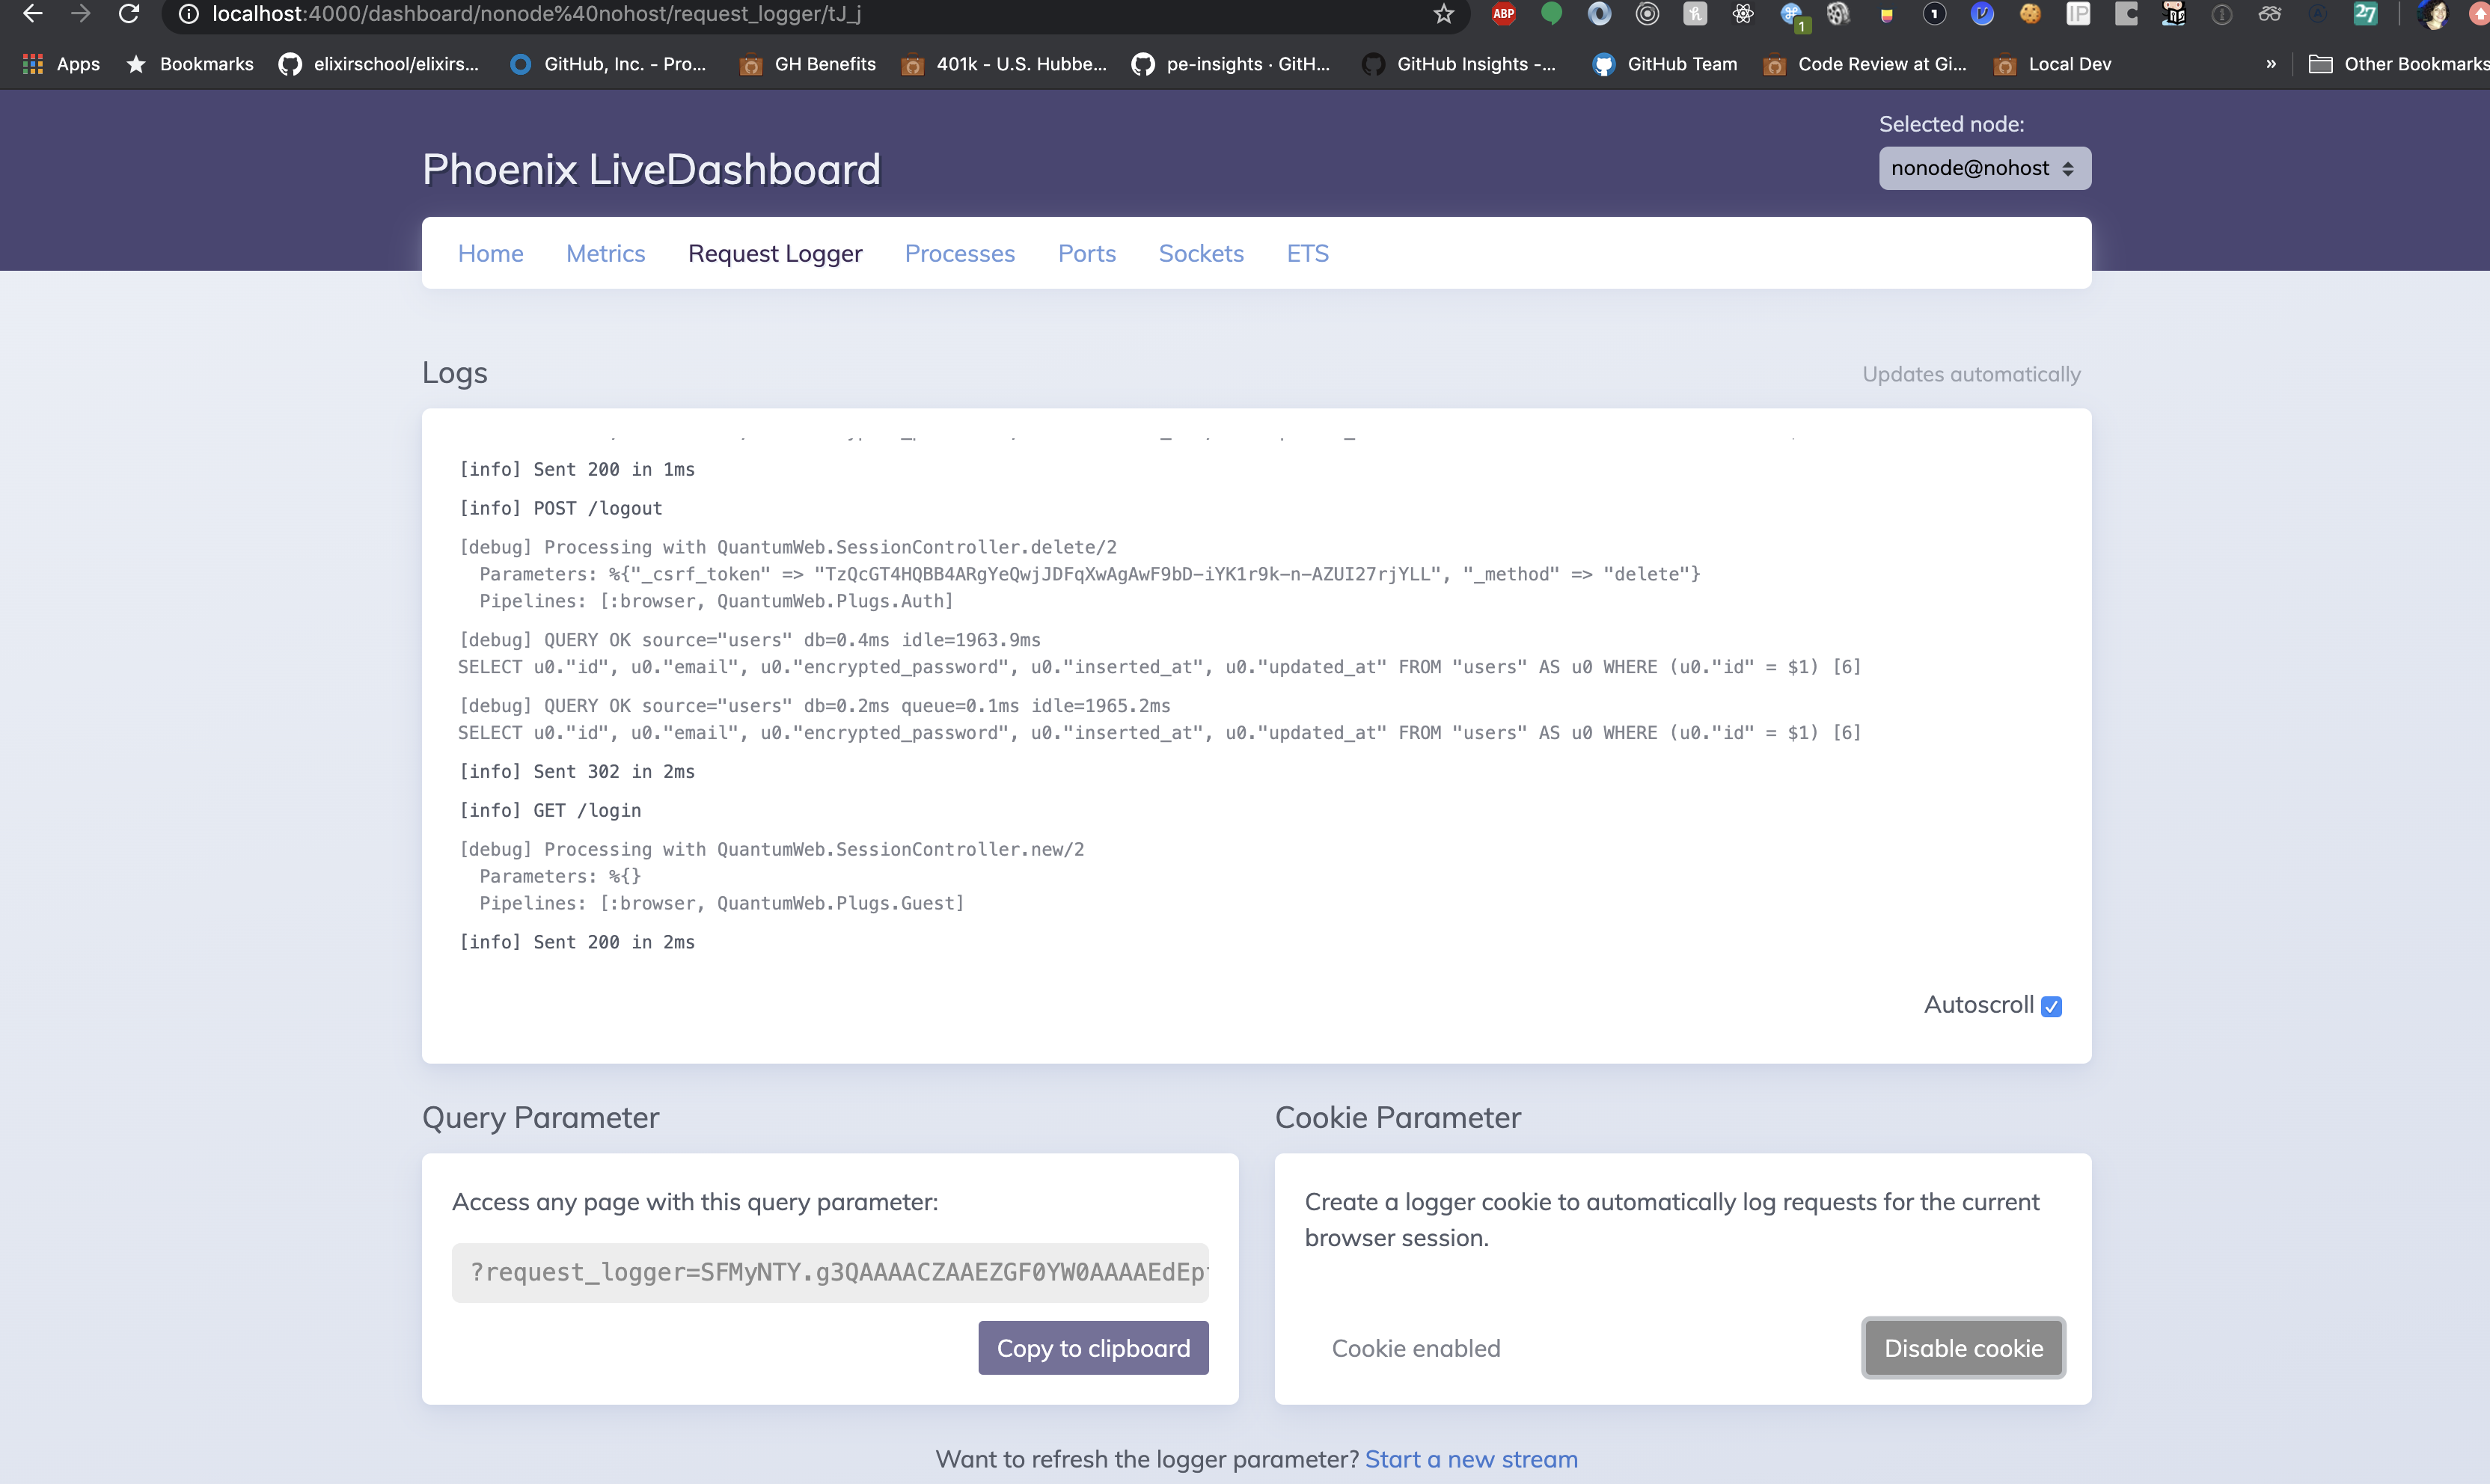
Now we can visit /dashboard in the browser and click the Request Logger tab. We’ll click “enable cookie” to enable a cookie that streams request logs. Now we should see the stream of our request logs:
Let’s take a brief look under the hood of LiveDashboard to get a better understanding of how RequestLogger works.
LiveDashboard RequestLogger Under The Hood
The LiveDashboard router mounts a LiveView, Phoenix.LiveDashboard.RequestLoggerLive:
# live_dashboard/router.ex
live "/:node/request_logger",
     Phoenix.LiveDashboard.RequestLoggerLive,
     :request_logger,
     opts
The RequestLoggerLive LiveView grabs the main application’s PubSub server from the endpoint and subscribes to a “request logger” topic:
# live_dashboard/live/request_logger_love.ex

def mount(%{"stream" => stream} = params, session, socket) do
  %{"request_logger" => {param_key, cookie_key}} = session

  if connected?(socket) do
    endpoint = socket.endpoint
    pubsub_server = endpoint.config(:pubsub_server) || endpoint.__pubsub_server__()
    Phoenix.PubSub.subscribe(pubsub_server, Phoenix.LiveDashboard.RequestLogger.topic(stream))
  end

  socket =
    socket
    |> assign_defaults(params, session)
    |> assign(
      stream: stream,
      param_key: param_key,
      cookie_key: cookie_key,
      cookie_enabled: false,
      autoscroll_enabled: true,
      messages_present: false
    )

  {:ok, socket, temporary_assigns: [messages: []]}
end
This means that the RequestLoggerLive LiveView process is subscribed to any events that are broadcast over the “request logger” topic. It implements a handle_info/2 function for {:logger, level, message} events, and responds by updating the socket and therefore the UI:
# live_dashboard/live/request_logger_live.ex
def handle_info({:logger, level, message}, socket) do
  {:noreply, assign(socket, messages: [{message, level}], messages_present: true)}
end
When do {:logger, level, message} events get broadcast over PubSub to this topic?
LiveDashboard adds a new logging backend to the application when it starts up.
# live_dashboard/application.ex
defmodule Phoenix.LiveDashboard.Application do
  @moduledoc false
  use Application

  def start(_, _) do
    Logger.add_backend(Phoenix.LiveDashboard.LoggerPubSubBackend) # HERE!

    children = [
      {DynamicSupervisor, name: Phoenix.LiveDashboard.DynamicSupervisor, strategy: :one_for_one}
    ]

    Supervisor.start_link(children, strategy: :one_for_one)
  end
end
The Phoenix.LiveDashboard.LoggerPubSubBackend broadcasts the log message to the RequestLogger PubSub topic whenever it receives a log event:
# live_dashboard/logger_pubsub_backend.ex
def handle_event({level, gl, {Logger, msg, ts, metadata}}, {format, keys} = state)
    when node(gl) == node() do
  with {pubsub, topic} <- metadata[:logger_pubsub_backend] do
    metadata = take_metadata(metadata, keys)
    formatted = Logger.Formatter.format(format, level, msg, ts, metadata)
    Phoenix.PubSub.broadcast(pubsub, topic, {:logger, level, formatted}) # HERE!
  end

  {:ok, state}
end
And that’s it!
Conclusion
LiveDashboard adds a powerful tool to the Phoenix developer’s toolkit. Now we can easily visualize the instrumentation of our application and monitor its performance and behavior in real-time as we develop. LiveDashboard represents one more entry into the growing pantheon of “developer happiness” tools that is increasingly making Phoenix, and Elixir, such a compelling option for web development.
I hope this feature tour got you excited about LiveDashboard, while our peek under the hood illustrates once again how Elixir language features like ETS and message-passing make it possible to build powerful systems that are still simple and elegant.