Real-Time SVG Charts with Contex and LiveView
By Sophie DeBenedetto | Posted 2020-10-06
Learn how to use the Contex package to render server-side SVG charts that you can update in real-time with LiveView.
This post is inspired by some of my work, together with Bruce Tate, on Pragmatic Bookshelf’s upcoming book on LiveView. Elixir School is happy to be able to offer a give-away of a small number e-books once they are published, so stay tuned for updates!
As LiveView matures it is becoming clear that is much more than just a tool for building real-time features in your web app. LiveView is a state management system for your single page app. Developers are increasingly reaching for LiveView to build and manage the complexities of a full-featured SPA. This is why, in our upcoming LiveView book, we’re aiming to build out a diverse and robust set of features using LiveView.
Once such common feature is that of a real-time admin-facing dashboard. Such dashboards often require data visualization and LiveView means we can offer data viz in real-time. In this post, we’ll look at how to leverage the Contex library for server-side SVG chart rendering. We’ll render a Contex chart in a LiveView and update our chart in real-time. Along the way, I hope you’ll get excited about what you can do with LiveView, and what you can learn if you dive into our upcoming book.
The Problem
While there are quite a few JavaScript charting libraries to choose from, we’re after a server-side rendering solution. LiveView manages state on the server. State changes trigger re-renders the HTML, pushes that HTML to the client, which then efficiently updates the UI. So, we don’t want to bring in a library to render charts with lots of complex JavaScript on the client. We need to be able to draw our charts on the server and send that chart HTML down to the client.
While there aren’t many server-rendered chart libraries in Elixir, luckily for us, there is Contex!
Introducing Contex
Contex is a server-side charting library written in Elixir that allows us to build and render SVG charts on the server. We can then use LiveView to render these charts in a template and enable them to be updated in real-time. Contex currently supports bar charts, point plots, gantt charts and sparkline charts.
It’s worth mentioning that there are a few other server-side charting libraries in Elixir. The ggity is designed to “bring interface of R’s ggplot2 library to the task of drawing SVG plots with Elixir” and supports a number of different chart types. The plotex library builds and renders time plot series SVG charts on the server. The ggity library, while likely a good choice for exploratory data analysis, is not optimized for use with LiveView nor is it currently intended for production use and the plotex library is aimed at rendering time plot series charts only. So, contex, while still a new library with some in-progress TODOs, is most closely aligned with our need to performantly render data in LiveView, in real-time, in a variety of formats.
In this post, we’ll focus on using Contex to build a bar chart.
What We’ll Build
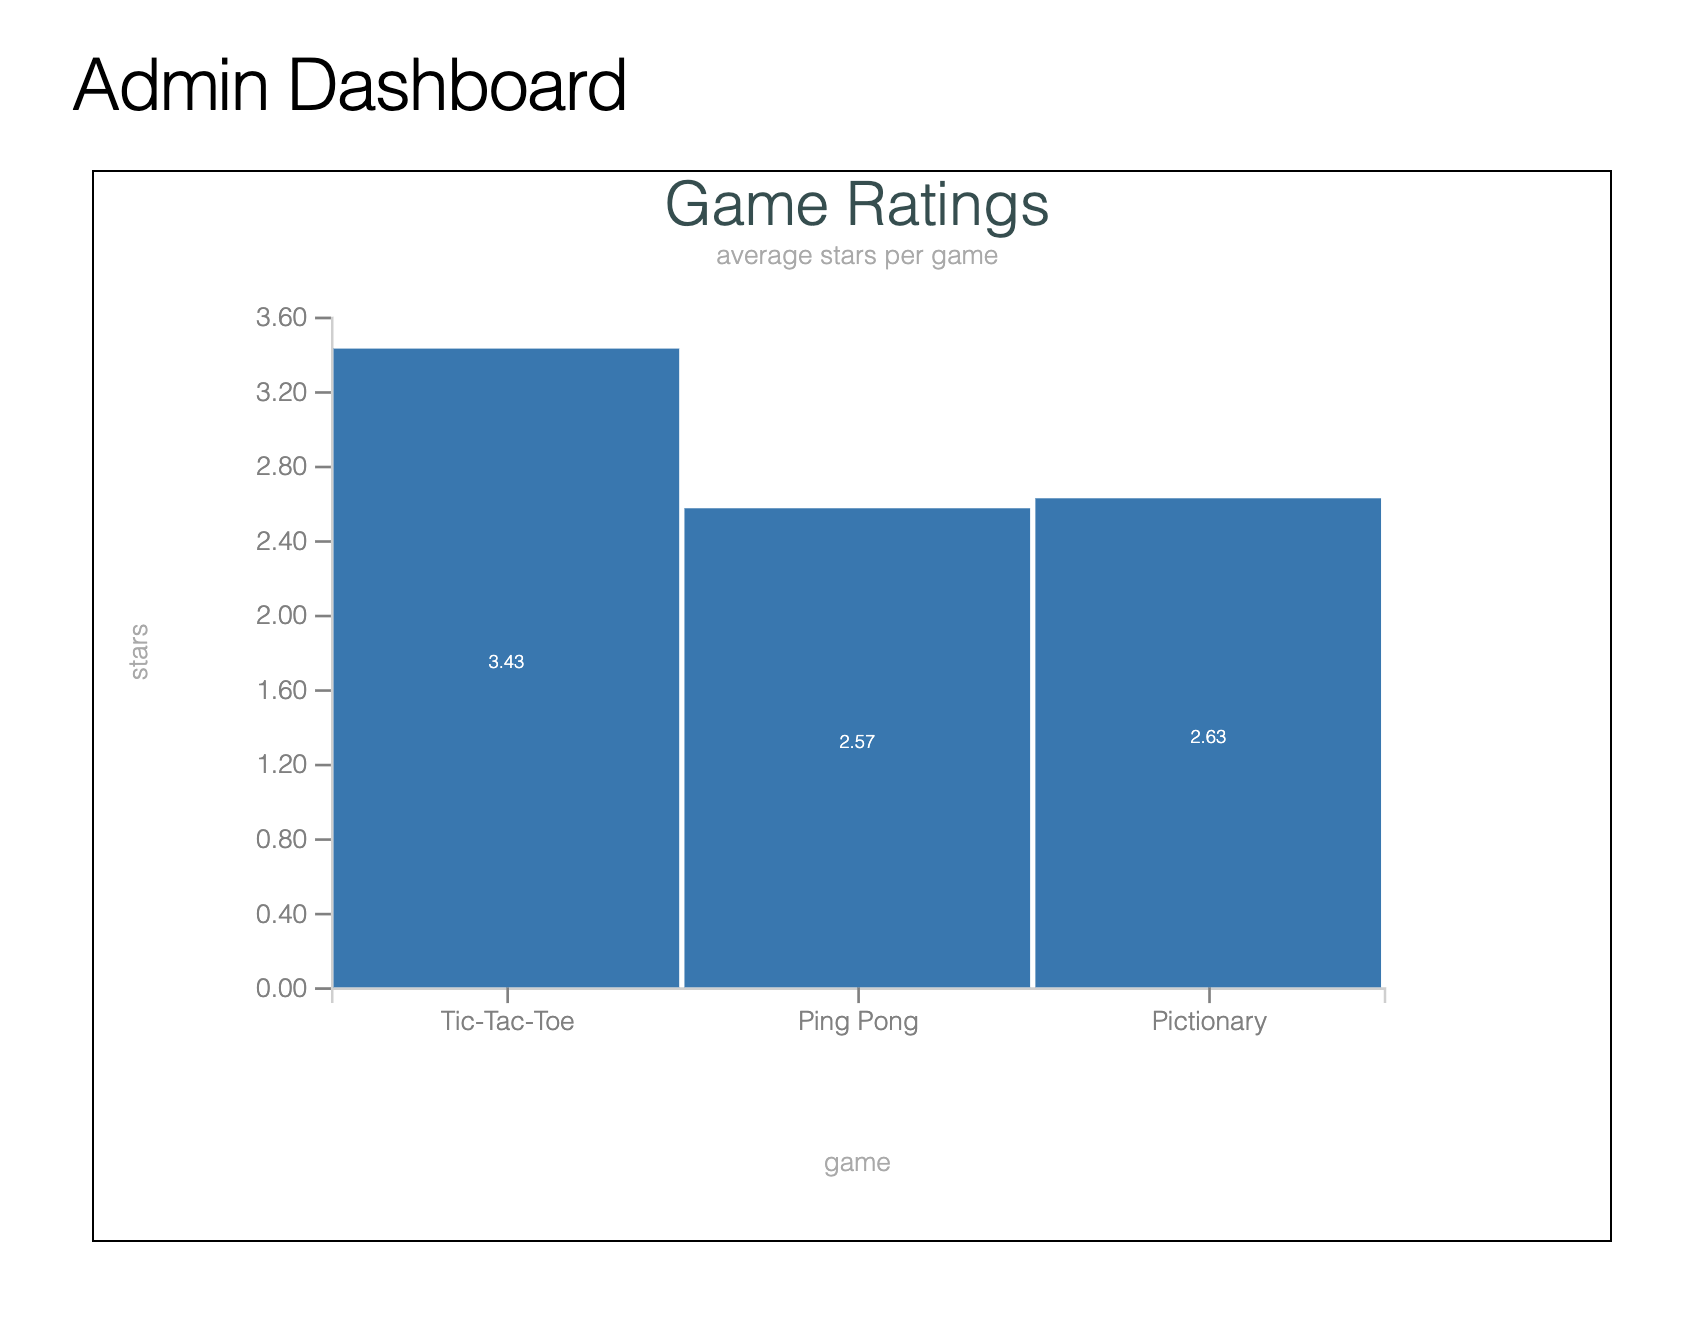
Drawing from an example that you’ll see in greater depth in our upcoming LiveView book, we’ll add a chart to our Admin Dashboard LiveView. The Admin Dashboard is part of an online gaming app in which users can play online versions of games like ping-pong and tic-tac-toe. We ask users to fill our a survey that rates games on a scale of 1 to 5 stars. Our Admin Dashboard should include a chart of products and their average star ratings. Something like this:
The chart should also update in real-time. In other words, as users around the world use and review our extremely popular and super fun games, the chart should update in real-time to reflect updated average ratings.
For the purposes of this post, we’ll assume we already have a LiveView GameStoreWeb.AdminDashboardLive, mounted at live '/admin-dashboard'.
This LiveView renders a stateful child component, GameStoreWeb.GameRatingsLive. This component is where we will build and render our bar chart.
Taking a brief look at our AdminDashboardLive LiveView, we can see it establishes a socket assignment, :game_ratings_component_id:
# lib/game_store_web/live/admin_dashboard_live.ex
defmodule GameStoreWeb.AdminDashboardLive do
  def mount(_params, _session, socket)
    {:ok,
     socket
     |> assign(:game_ratings_component_id, "game-ratings")}
  end
end
Then, we use this assignment to set the :id of our stateful component:
# lib/game_store_web/live/admin_dashboard_live.html.leex
<%= live_component @socket,
      GameStoreWeb.GameRatingsLive,
      id: @game_ratings_component_id %>
We’re storing the component’s ID in socket assigns so that we can use it later to send updates to the component with the help of the send_update/2 function. More on that later.
Getting Started
First off, we’ll add the Contex package to our app’s dependencies in the mix.exs file:
{:contex, "0.3.0"}
Run mix deps.get to install the new dependency.
Querying Data To Chart
Before we can render our bar chart, we need to query for and format our data for the chart. We’ll write query that selects all of the games, along with the average rating for each game.
We’ll implement our query in a query builder module defined in the core of application. The functional core of our application is where we put all of the code that is predictable and reliable. Working with the data in our database is a great example of something that is just that. Let’s take a look at our query now.
In our data model, we games that have many ratings. So, we’ll query for games, joined on the ratings table, and select the game name and a computed average of all of the given game’s ratings’ stars.
# lib/catalogue/game/query.ex
defmodule GameStore.Catalogue.Game.Query do
  alias GameStore.Survey.Rating

  def base do
    Game
  end

  def with_average_ratings(query \\ base()) do
    query
    |> join_ratings
    |> average_ratings
  end

  defp join_ratings(query) do
    query
    |> join(:inner, [g], r in Rating, on: r.game_id == g.id)
  end

  defp average_ratings(query) do
    query
    |> group_by([g], g.id)
    |> select([g, r], {g.name, fragment("?::float", avg(r.stars))})
  end
end
While the work of composing queries is predictable and reliable, the work of executing queries is anything but. You can’t be certain of what the results of executing a database query will be, and such work is often dependent on input from a user. So, the execution of our query will be the responsibility of our app’s Catalogue context. The context acts as our application’s boundary, and it’s where we can located code that deals with uncertainty and with input from the outside world.
Let’s wrap up our query in a context function in the Catalogue context now. We execute our query by piping it to a call to Repo.all()
# lib/catalogue.ex
defmodule GameStore.Catalogue do
  alias GameStore.Catalogue.Game
  alias GameStore.Repo

  def games_with_average_ratings do
    Game.Query.with_average_ratings
    |> Repo.all()
  end
end
Let’s take a look at the results of executing this query now:
iex> alias GameStore.Repo
iex(4)> Catalogue.games_with_average_ratings()
[debug] QUERY OK source="games" db=6.1ms decode=2.1ms queue=7.1ms idle=1495.6ms
SELECT g0."name", avg(r1."stars")::float FROM "games" AS g0 INNER JOIN "ratings" AS r1 ON r1."game_id" = g0."id" GROUP BY g0."id" []
[
  {"Tic-Tac-Toe", 3.4285714285714284},
  {"Ping Pong", 2.5714285714285716},
  {"Pictionary", 2.625}
]
Note that we’ve chosen for our query to select and return a collection of results, each of which is a tuple with two elements. The first element is the name of the game and the second element is the average rating. This format is purposeful, designed for use in our Contex bar chart.
Let’s turn our attention to building out that chart with this data now.
Defining Your Chart in LiveView
Before we build out or component in earnest, it’s worth mentioning the pattern that we will be applying to manage state in that component. We’ll rely on reducers to successively update socket state to initialize the starting state of our component and handle updates. Reducers are functions that take a thing and return an updated thing of the same type. They allow us to compose neat, clean pipelines that make it easy to build and manage LiveView state and respond to events by updating that state. This is a pattern that we’ll go into greater depth on in our LiveView book.
Storing Chart Data in State
First off, we’ll teach our GameRatingsLive component to query for these games with average ratings and keep them in the socket assigns.
Recall that earlier we said that we’re rendering the GameRatingsLive component as a stateful component in the AdminDashboardLive LiveView. We’ll leverage the stateful component’s update/2 lifecycle method to fetch our game and ratings data and store it in socket assigns.
# lib/game_store_web/live/game_ratings_live.ex
defmodule GameStoreWeb.GameRatingsLive do
  use GameStoreWeb, :live_component
  alias GameStore.Catalogue

  def update(assigns, socket) do
    {:ok,
     socket
     |> assign(assigns)
     |> assign_games_with_average_ratings()}
  end

  defp assign_games_with_average_ratings(socket) do
    socket
    |> assign(:games_with_average_ratings, Catalogue.games_with_average_ratings())
  end
end
Note that we’re piping our socket through a set of reducers, each of which further decorate the socket state. These reducer functions take in an argument of the socket, do something to that socket, and return a new socket with the updated state.
First, we’ll apply whatever assigns have come in from the parent LiveView, then we’ll add a key of :games_with_average_ratings to assigns, pointing to a value of our query results.
Now that we have our query results available in state, we’re ready to use them to build our chart.
Building The Bar Chart
There are three stages to building a Contex chart:
- Initializing the dataset
- Initializing the chart
- Rendering the chart to SVG
We’ll add a reducer to our update/2 pipeline that updates socket state for each step in this process.
Initializing the DataSet
The first step of building a Contex chart is to initialize the data set with the Contex.DataSet module. The DataSet module wraps your dataset for plotting charts. It provides a set of convenience functions that subsequent chart plotting modules will leverage to operate on and chart your data. Dataset handles several different data structures by marshalling them into a consistent form for consumption by the chart plotting functions. The data structures it can handle are: a list of maps, list of lists or a list of tuples. Recall that we ensured that our query for games with average ratings returns a list of tuples.
We’ll begin by implementing a new reducer function, assign_dataset/1. This reducer will initialize a new DataSet with the query results, our list of game and average rating tuples, from socket assigns. Then, it will add the dataset to socket state:
# lib/game_store_web/live/game_ratings_live.ex
defmodule GameStoreWeb.GameRatingsLive do
  use GameStoreWeb, :live_component
  alias GameStore.Catalogue

  def update(assigns, socket) do
    {:ok,
     socket
     |> assign(assigns)
     |> assign_games_with_average_ratings()
     |> assign_dataset()}
  end

  # ...

  defp assign_dataset(%{assigns: %{games_with_average_ratings: games_with_average_ratings}} = socket) do
    socket
    |> assign(:dataset, Contex.Dataset.new(games_with_average_ratings))
  end
end
If we take a look at the output of our call to Contex.DataSet.new/1, we’ll see the following struct:
%Contex.Dataset{
  data: [
    {"Tic-Tac-Toe", 3.4285714285714284},
    {"Ping Pong", 2.5714285714285716},
    {"Pictionary", 2.625}
  ],
  headers: nil,
  title: nil
}
The DataSet considers the first element of a given tuple in the list to be the “category column” and the second element to be the “value column”. The category column is used to label the bar chart category (in our case the game name), and the value column is used to populate the value of that category.
Initializing the BarChart
Now that we have our dataset, we can use it to initialize our BarChart. We’ll do this in a subsequent reducer that we’ll add to the update/2 pipeline, assign_chart/1.
# lib/game_store_web/live/game_ratings_live.ex
defmodule GameStoreWeb.GameRatingsLive do
  use GameStoreWeb, :live_component
  alias GameStore.Catalogue

  def update(assigns, socket) do
    {:ok,
     socket
     |> assign(assigns)
     |> assign_games_with_average_ratings()
     |> assign_dataset()
     |> assign_chart()}
  end

  defp assign_chart(%{assigns: %{dataset: dataset}} = socket) do
    socket
    |> assign(:chart, Contex.BarChart.new(dataset))
  end
end
The call to BarChart.new/1 will create a BarChart struct that describes how to plot the bar chart. Let’s take a look at this struct now:
%Contex.BarChart{
  axis_label_rotation: :auto,
  category_scale: %Contex.OrdinalScale{
    domain: ["Tic-Tac-Toe", "Ping Pong", "Pictionary"],
    domain_to_range_band_fn: #Function<2.33130404/1 in Contex.OrdinalScale.update_transform_funcs/1>,
    domain_to_range_fn: #Function<1.33130404/1 in Contex.OrdinalScale.update_transform_funcs/1>,
    padding: 2,
    range: {0, 100},
    range_to_domain_fn: #Function<4.33130404/1 in Contex.OrdinalScale.update_transform_funcs/1>
  },
  colour_palette: :default,
  custom_value_formatter: nil,
  data_labels: true,
  dataset: %Contex.Dataset{
    data: [
      {"Tic-Tac-Toe", 3.4285714285714284},
      {"Ping Pong", 2.5714285714285716},
      {"Pictionary", 2.625}
    ],
    headers: nil,
    title: nil
  },
  height: 100,
  mapping: %Contex.Mapping{
    accessors: %{
      category_col: #Function<11.109991709/1 in Contex.Dataset.value_fn/2>,
      value_cols: [#Function<11.109991709/1 in Contex.Dataset.value_fn/2>]
    },
    column_map: %{category_col: 0, value_cols: [1]},
    dataset: %Contex.Dataset{
      data: [
        {"Tic-Tac-Toe", 3.4285714285714284},
        {"Ping Pong", 2.5714285714285716},
        {"Pictionary", 2.625}
      ],
      headers: nil,
      title: nil
    },
    expected_mappings: [category_col: :exactly_one, value_cols: :one_or_more]
  },
  options: [orientation: :vertical],
  orientation: :vertical,
  padding: 2,
  phx_event_handler: nil,
  select_item: nil,
  series_fill_colours: %Contex.CategoryColourScale{
    colour_map: %{1 => "1f77b4"},
    colour_palette: ["1f77b4", "ff7f0e", "2ca02c", "d62728", "9467bd", "8c564b",
     "e377c2", "7f7f7f", "bcbd22", "17becf"],
    default_colour: nil,
    values: [1]
  },
  type: :stacked,
  value_range: nil,
  value_scale: %Contex.ContinuousLinearScale{
    custom_tick_formatter: nil,
    display_decimals: 2,
    domain: {0, 3.4285714285714284},
    interval_count: 9,
    interval_size: 0.4,
    nice_domain: {0.0, 3.6},
    range: {100, 0}
  },
  width: 100
}
The BarChart has a number of configurable options with defaults, all of which are listed in the documentation here. For example, we can set the orientation (which defaults to vertical), the colors, the padding and more.
We can leverage the exposed configuration functions to update these defaults. Let’s take a look at how we can manipulate the color of our chart:
# lib/game_store_web/live/game_ratings_live.ex
defp assign_chart(%{assigns: %{dataset: dataset}} = socket) do
  socket
  |> assign(
    :chart,
    dataset
    |> Contex.BarChart.new()
    |> Contex.BarChart.colours(:warm))
end
This will cause our chart to render with the “warm” color scheme.
It’s important to note again that the first column of the dataset is used as the category column (i.e. the bar), and the second column is used as the value column (i.e. the bar height). This is managed through the :column_map attribute. We can see our BarChart struct has the following :column_map value:
column_map: %{category_col: 0, value_cols: [1]}
The values of 0 and [1] refer to the indices of elements in the tuples in our DataSet. The element at the 0 index will be considered the “category” and the element and the 1 index will be considered the “value”. Our tuples have the game name at the zero index and the average rating at the 1 index, so our game names will be treated at the category and their average ratings the value.
Render the Chart SVG
The Contex.Plot module will plot our data and render it to SVG markup. We’ll add another reducer to our pipeline, assign_chart_svg. This reducer will initialize and configure the Contex.Plot and render it to SVG. Then, it will assign this SVG to the :chart_svg key in socket assigns.
The Plot module manages the layout of the chart plot–the chart title, axis labels, legend, etc. We initialize our Plot with the plot width and height, and the chart struct:
# lib/game_store_web/live/game_ratings_live.ex
defmodule GameStoreWeb.GameRatingsLive do
  use GameStoreWeb, :live_component
  alias GameStore.Catalogue

  def update(assigns, socket) do
    {:ok,
     socket
     |> assign(assigns)
     |> assign_games_with_average_ratings()
     |> assign_dataset()
     |> assign_chart()
     |> assign_chart_svg()}
  end

  defp assign_chart_svg(%{assigns: %{chart: chart}} = socket) do
    Plot.new(500, 400, chart)
  end
end
We’ll customize our plot with a chart table and some labels for the x- and y-axis:
defp assign_chart_svg(%{assigns: %{chart: chart}} = socket) do
  Plot.new(500, 400, chart)
  |> Plot.titles("Game Ratings", "average stars per game")
  |> Plot.axis_labels("games", "stars")
end
This will (you guessed it), apply the title, subtitles and axis labels to our chart.
Now we’re ready to transform our plot into an SVG with the help of the Plot module’s to_svg/1 function. We’ll also be sure to add the generated SVG to socket assigns:
defp assign_chart_svg(%{assigns: %{chart: chart}} = socket) do
  socket
  |> assign(
    :chart_svg,
    Plot.new(500, 400, chart)
    |> Plot.titles("Game Ratings", "average stars per game")
    |> Plot.axis_labels("games", "stars")
    |> Plot.to_svg())
end
Now we’re ready to render this SVG markup in our template.
Rendering the Chart in the Template
Our GameRatingsLive template is pretty simple, it renders the SVG stored in the @chart_svg assignment:
<!-- lib/game_store_web/live/game_ratings_live.html.leex -->

<div>
  <%= @chart_svg %>
</div>
Now, we should see the following chart rendered when we navigate to /admin-dashboard:
One “gotcha” that I’ll point out is that, in order to get the column labels (i.e. game names and star values) to be visible, I had to apply the custom CSS borrowed from the Contex example app here, and copied below:
.exc-tick {
  stroke: grey;
}

.exc-tick text {
  fill: grey;
  stroke: none;
}

.exc-grid {
  stroke: lightgrey;
}

.exc-legend {
  stroke: black;
}

.exc-legend text {
  fill: grey;
  font-size: 0.8rem;
  stroke: none;
}

.exc-title {
  fill: darkslategray;
  font-size: 2.3rem;
  stroke: none;
}
.exc-subtitle {
  fill: darkgrey;
  font-size: 1.0rem;
  stroke: none;
}

.exc-domain {
  stroke:  rgb(207, 207, 207);
}

.exc-barlabel-in {
  fill: white;
  font-size: 0.7rem;
}

.exc-barlabel-out {
  fill: grey;
  font-size: 0.7rem;
}
Now that our chart is rendering beautifully, let’s talk about updating it in real-time.
Real-Time Updates
The great news about rendering our chart in a LiveView is that we’ll get real-time updates for free! Should any state changes occur server-side, the chart will be automatically re-rendered with any new data. We could imagine, for example, leveraging PubSub to send a message to the parent AdminDashboardLive every time a user submits a new game rating. The AdminDashboard could then in turn use the send_update/2 function to update the child GameRatingsLive component, causing it to re-render and re-fetch the games with average ratings data from the database, thus rendering an updated chart with the latest game ratings. In this way, LiveView can manage the state of our single page in a way that reflects and is impacted by the overall state of our distributed application. Working with PubSub and LiveView is a little outside the scope of this post, but you can learn more about it in our earlier post on this topic here.
Aside from the free live updates our chart will benefit from, just by virtue of being rendered in LiveView, the Contex library does allow us to add event handlers to the chart itself. The BarChart module exposes a function, event_handler/2, which attaches a phx-click attribute to each bar element in the chart.
We’ll use this function to implement the following functionality:
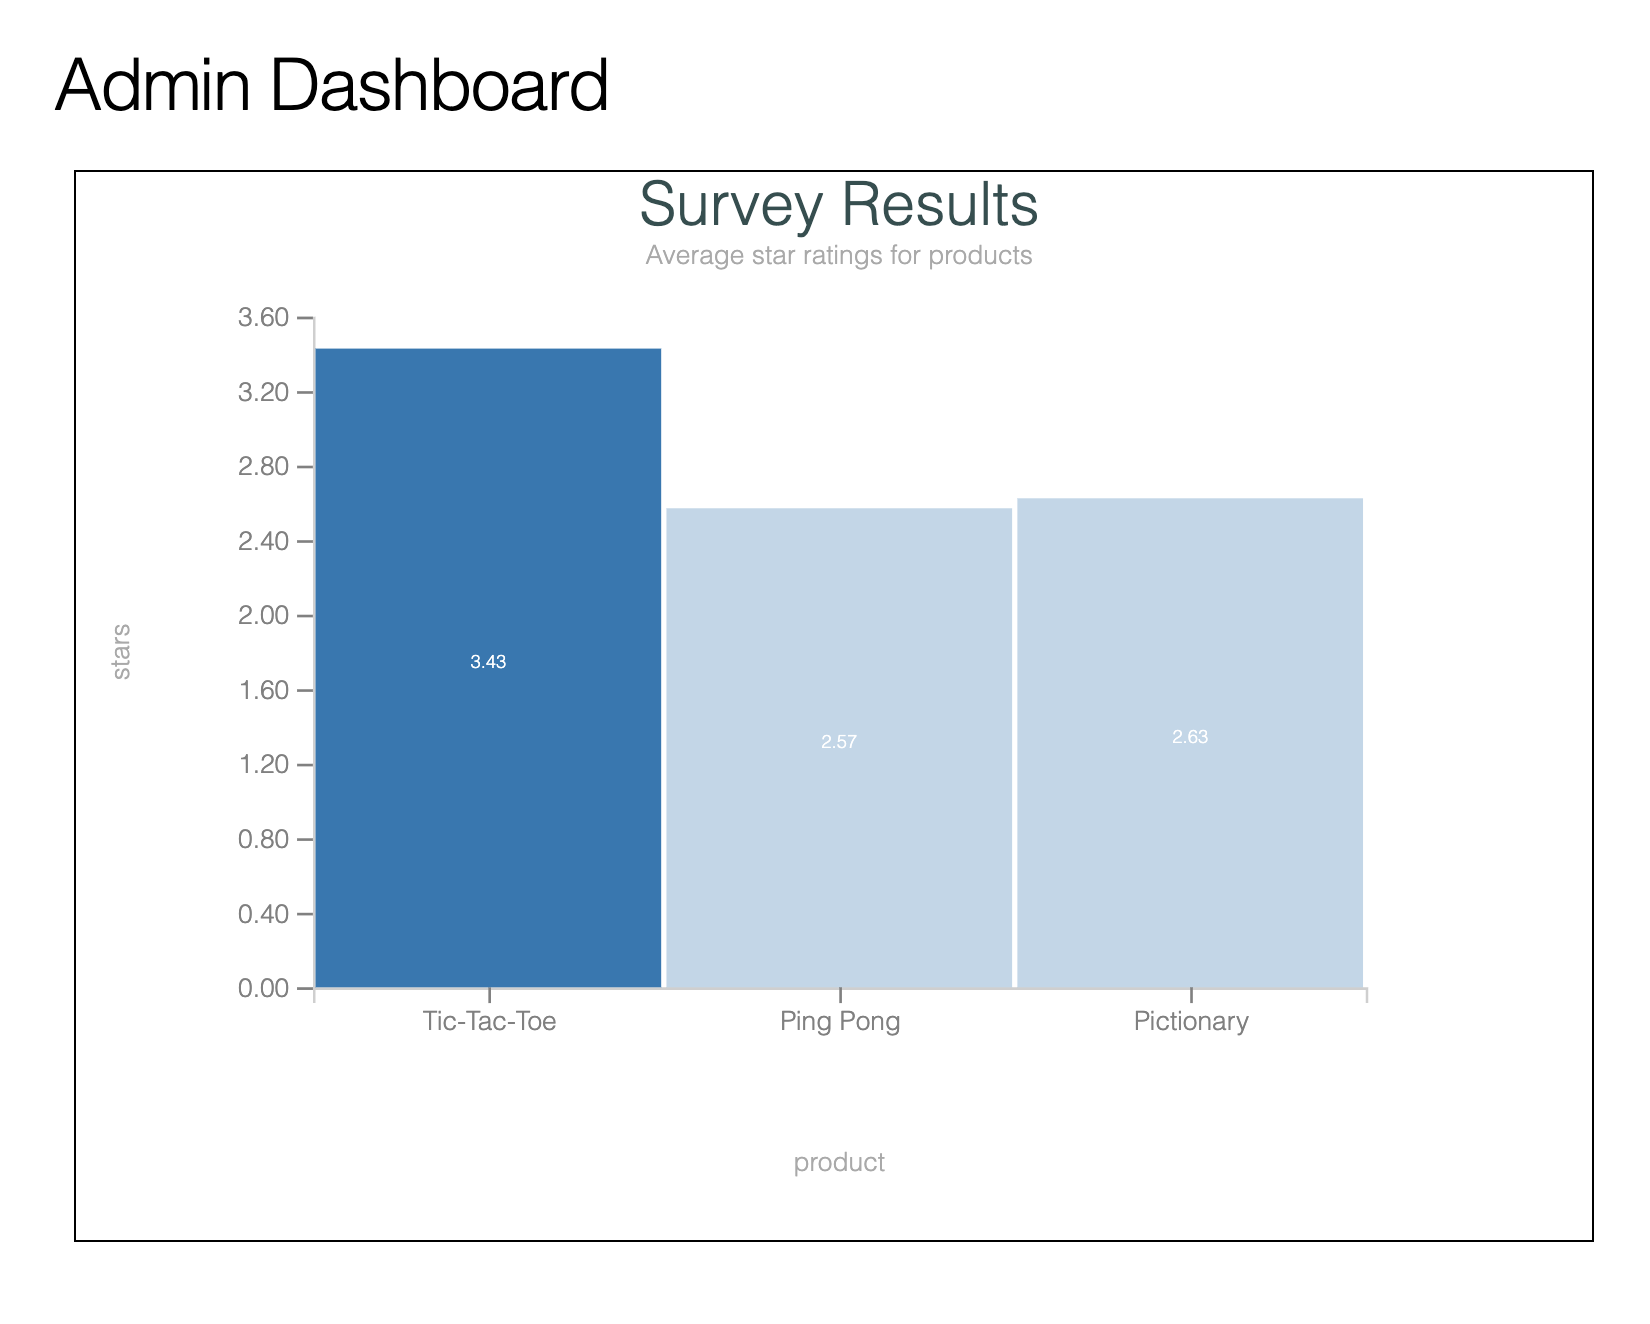
When a user clicks a given bar in our chart, Then that bar is highlighted
Something like this:
We’ll begin by using the BarChart.event_handler/2 function to add a phx-click event to the bars in our chart.
# lib/game_store_web/live/game_ratings_live.ex
defp assign_chart(%{assigns: %{dataset: dataset}} = socket) do
  socket
  |> assign(
    :chart,
    dataset
    |> Contex.BarChart.new()
    |> Contex.BarChart.colours(:warm))
    |> Contex.BarChart.event_handler("chart-bar-clicked")
end
Now let’s see what happens when we click a given bar in our chart and check our server logs:
[error] GenServer #PID<0.617.0> terminating
** (UndefinedFunctionError) function GameStoreWeb.AdminDashboardLive.handle_event/3 is undefined or private
GameStoreWeb.AdminDashboardLive.handle_event("chart-bar-clicked", %{"category" => "Tic-Tac-Toe", "series" => "1", "value" => "3.4285714285714284"}, #Phoenix.LiveView.Socket<assigns: %{flash: %{}, live_action: :index, live_module: GameStoreWeb.AdminDashboardLive, survey_results_component_id: "survey-results"}, changed: %{}, endpoint: GameStoreWeb.Endpoint, id: "phx-FjuQogS0osBJcgnD", parent_pid: nil, root_pid: #PID<0.617.0>, router: GameStoreWeb.Router, view: GameStoreWeb.AdminDashboardLive, ...>)
Oh no! Our parent LiveView crashed because we haven’t yet implemented the handle_event/3 function for our "chart-bar-clicked" event. You’ll notice that the event was sent to the parent LiveView, GameStoreWeb.AdminDashboardLive, and not our GameRatingsLive component. This is because, in order to send an event to a component, rather than it’s parent, it is necessary to add the phx-target=<%= @myself %> attribute to the element that contains the phx-click event (or other DOM element binding). The @myself assignment refers to the unique identifier for the current component.
However, the Contex package doesn’t (yet) allow us to specify the event target via the call to BarChart.event_handler/2. There is an open issue for just this work if there are any readers out there interested in contributing!
So, we’ll need to:
-
Implement the
handle_event/3function in the parent LiveView,AdminDashboardLive - Get the parent LiveView to send an update to the child component when it receives this event
-
Teach the child component,
GameRatingsLive, to render the SVG chart with a “category selection”
Let’s do it!
We’ll start with our handle_event/3 function. The function will pattern match the "chart-bar-clicked" event name and use the send_update/2 function to tell the GameRatingsLive component to re-render:
# lib/game_store_web/live/admin_dashboard_live.ex
defmodule GameStoreWeb.AdminDashboardLive do
  alias GameStoreWeb.GameRatingsLive
  def handle_event("chart-bar-clicked", payload, socket) do
    send_update(
      GameRatingsLive,
      socket.assigns.game_ratings_component_id,
      selected_category: payload)

    {:noreply, socket}
  end
end
send_update/2 is called with the name of the component that we want to update and a keyword list that will get passed to the updating component as the new assigns. The keyword list must include the ID that we are targeting for an update. Here, we’re pulling the component’s ID out of socket assigns where we stored it in the first part of this blog post.
With this call to send_update/2, we will cause the GameRatingsLive component to re-render and re-invoke the update/2 callback, this time with an assigns that includes our :selected_category key pointing to the click event payload. We’ll cover the send_update/2 function, and more options for communicating between child components and parent LiveViews, in the LiveView book. For now, it’s enough to understand that send_update/2 can be invoked from a parent LiveView to tell a component that is running in the LiveView to update.
Now we’re ready to teach the GameRatingsLive component how to render a Contex BarChart with a selected category. We can do this with the help of the BarChart.select_item/2. This function takes in two arguments, the current BarChart struct and a map that looks like this:
%{category: category, series: series}
Luckily, this is just the data that was sent through in our click event payload and that is now available in assigns under the :selected_category key!
Let’s update our component’s assign_chart/1 function to use the :selected_category info from assigns, if it is present, and apply it to the bar chart:
# lib/game_store_web/live/game_ratings_live.ex
defp assign_chart(%{assigns: %{dataset: dataset}} = socket) do
  socket
  |> assign(
    :chart,
    dataset
    |> Contex.BarChart.new()
    |> Contex.BarChart.colours(:warm))
    |> Contex.BarChart.event_handler("chart-bar-clicked")
    |> maybe_select_category()
end

defp maybe_select_category(
      chart,
      %{assigns: %{selected_category: %{"category" => category, "series" => series}}} = socket
    ) do
  chart
  |> BarChart.select_item(%{category: category, series: String.to_integer(series)})
end

defp maybe_select_category(chart, _socket) do
  chart
end
Here we’re adding a conditional reducer maybe_select_category/2, to our chart creation pipeline. If it is called with a socket that contains the :selected_category assignment (as would be the case if the component is updating courtesy of the parent receiving the click event), then it will apply the selected category values to the BarChart.select_item/2 function. Otherwise, it will simply return the un-changed chart.
Now, if we point our browser at /admin-dashboard and click a given bar chart category bar, we should see it highlighted appropriately!
Conclusion
We can see that Contex is a powerful and flexible tool for server-side SVG charting in Elixir. On top of that, it seamlessly integrates into our LiveView, accommodating real-time updates and even allowing us to attach phx-click events to chart elements. I hope to see the Contex library grow even further and encourage anyone reading to try it our and consider contributing.
Beyond our look at Contex, we touched on a lot of LiveView concepts here. We took a look at how core/boundary application design comes into play in our LiveView features, we leveraged stateful components and saw how parent LiveViews can communicate to their child components and we wrote some nice, organized LiveView code that leveraged reducers to establish socket state. For a deeper dive into these concepts and more, don’t forget to check out Pragmatic Bookshelf’s upcoming LiveView book, and keep an eye out for Elixir School’s LiveView book give-away!
Resources
For a closer look at Contex: