Benchee
We can’t guess about which functions are fast and which are slow - we need actual measurements when we’re curious. That’s where benchmarking comes in. In this lesson, we’ll learn about how easy it is to measure the speed of our code.
About Benchee
While there is a function in Erlang that can be used for basic measurements of a function’s execution time, it’s not as nice to use as some of the available tools and it doesn’t give you multiple measurements to get useful statistics from, so we’re going to use Benchee. Benchee provides us with a range of statistics with easy comparisons between scenarios, a great feature that allows us to test different inputs to the functions we’re benchmarking, and several different formatters that we can use to display our results, as well as the ability to write your formatter if desired.
Usage
To add Benchee to your project, add it as a dependency to your mix.exs file:
defp deps do
  [{:benchee, "~> 1.0", only: :dev}]
end
Then we call:
$ mix deps.get
...
$ mix compile
The first command downloads and installs Benchee. You may be asked to install Hex along with it. The second compiles the Benchee application. Now we’re ready to write our first benchmark.
An important note before we begin: When benchmarking, it is important to not use iex since that behaves differently and is often much slower than how your code is most likely being used in production.
So, let’s create a file that we’re calling benchmark.exs, and in that file we’ll add the following code:
list = Enum.to_list(1..10_000)
map_fun = fn i -> [i, i * i] end

Benchee.run(%{
  "flat_map"    => fn -> Enum.flat_map(list, map_fun) end,
  "map.flatten" => fn -> list |> Enum.map(map_fun) |> List.flatten() end
})
Now to run our benchmark, we call:
mix run benchmark.exsAnd we should see something like the following output in your console:
Operating System: Linux
CPU Information: Intel(R) Core(TM) i7-4790 CPU @ 3.60GHz
Number of Available Cores: 8
Available memory: 15.61 GB
Elixir 1.8.1
Erlang 21.3.2

Benchmark suite executing with the following configuration:
warmup: 2 s
time: 5 s
memory time: 0 ns
parallel: 1
inputs: none specified
Estimated total run time: 14 s

Benchmarking flat_map...
Benchmarking map.flatten...

Name                  ips        average  deviation         median         99th %
flat_map           2.40 K      416.00 μs    ±12.88%      405.67 μs      718.61 μs
map.flatten        1.24 K      806.20 μs    ±20.65%      752.52 μs     1186.28 μs

Comparison:
flat_map           2.40 K
map.flatten        1.24 K - 1.94x slower +390.20 μs
Of course, your system information and results may be different depending on the specifications of the machine you are running your benchmarks on, but this general information should all be there.
At first glance, the Comparison section shows us that our map.flatten version is 1.94x slower than flat_map. It also shows that on average it is about 390 microseconds slower which puts things into perspective. All helpful to know! However, let’s look at the other statistics that we get:
- ips - this stands for “iterations per second,” which tells us how often the given function can be executed in one second. For this metric, a higher number is better.
- average - this is the average execution time of the given function. For this metric, a lower number is better.
- deviation - this is the standard deviation, which tells us how much the results for each iteration varies in the results. Here it is given as a percentage of the average.
-
median - when all measured times are sorted, this is the middle value (or average of the two middle values when the number of samples is even).
Because of environmental inconsistencies this is more stable than the
average, and somewhat more likely to reflect the normal performance of your code in production. For this metric, a lower number is better. - 99th % - 99% percent of all measurements are faster than this, which makes this sort of worst case performance. Lower is better.
There are also other available statistics, but these five are frequently the most helpful and commonly used for benchmarking, which is why they are displayed in the default formatter. To learn more about the other available metrics, check out the documentation on hexdocs.
Configuration
One of the best parts of Benchee is all the available configuration options. We’ll go over the basics first since they don’t require code examples, and then we’ll show how to use one of the best features of Benchee - inputs.
Basics
Benchee takes a wealth of configuration options.
In the most common Benchee.run/2 interface, these are passed as the second argument in the form of an optional keyword list:
Benchee.run(%{"example function" => fn -> "hi!" end},
  warmup: 4,
  time: 10,
  inputs: nil,
  parallel: 1,
  formatters: [Benchee.Formatters.Console],
  print: [
    benchmarking: true,
    configuration: true,
    fast_warning: true
  ],
  console: [
    comparison: true,
    unit_scaling: :best
  ]
)
The available options are the following (also documented in hexdocs).
- warmup - the time in seconds for which a benchmarking scenario should be run without measuring times before real measurements start. This parameter simulates a “warm” running system. Defaults to 2.
- time - the time in seconds for how long each benchmarking scenario should be run and measured. Defaults to 5.
- memory_time - the time in seconds for how long memory consumption should be measured for every benchmarking scenario. We’ll look at that later. Defaults to 0.
-
inputs - a map with strings representing the input name as the keys and the actual input as the values. Can also be a list of tuples in the form
{input_name, actual_value}Defaults tonil(no inputs). We’ll cover this in detail in the next section. -
parallel - the number of processes to use to benchmark your functions.
So, if you set
parallel: 4, then 4 processes are spawned that all execute the same function for the giventime. When these finish, then 4 new processes are spawned for the next function. This gives you more data in the same time, but also puts a load on the system interfering with benchmark results. This can be useful to simulate a system under load which is sometimes helpful, but should be used with some caution as this can affect results in unpredictable ways. Defaults to 1 (which means no parallel execution). -
formatters - a list of formatters either as a module implementing the formatter behaviour, a tuple of said module and options it should take or formatter functions. They are run when using
Benchee.run/2. Functions need to accept one argument (which is the benchmarking suite with all data) and then use that to produce output. Defaults to the builtin console formatterBenchee.Formatters.Console. We’ll cover this more in a later section. - measure_function_call_overhead - Measure how long an empty function call takes and deduct this from each measured run time. Helps with the accuracy of very fast benchmarks. Defaults to true.
-
pre_check - whether or not to run each job with each input - including all given before or after scenario or each hooks - before the benchmarks are measured to ensure that your code executes without error. This can save time while developing your suites. Defaults to
false. -
save - specify a
pathwhere to store the results of the current benchmarking suite, tagged with the specifiedtag. See Saving & Loading in the Benchee docs. - load - load a saved suite or suites to compare your current benchmarks against. Can be a string or a list of strings or patterns. See Saving & Loading in the Benchee docs.
-
print - a map or keyword list with the following options as atoms for the keys and values of either
trueorfalse. This lets us control if the output identified by the atom is printed during the standard benchmarking process. All options are enabled by default (true). Options are:- benchmarking - print when Benchee starts benchmarking a new job.
- configuration - a summary of configured benchmarking options including estimated total run time is printed before benchmarking starts.
- fast_warning - warnings are displayed if functions are executed too fast, potentially leading to inaccurate measures.
-
unit_scaling - the strategy for choosing a unit for durations and counts.
When scaling a value, Benchee finds the “best fit” unit (the largest unit for which the result is at least 1).
For example,
1_200_000scales to 1.2 M, while800_000scales to 800 K. The unit scaling strategy determines how Benchee chooses the best fit unit for an entire list of values, when the individual values in the list may have different best fit units. There are four strategies, all given as atoms, defaulting to:best:- best - the most frequent best fit unit is used. A tie results in the larger unit being selected.
- largest - the largest best fit unit is used
- smallest - the smallest best fit unit is used
- none - no unit scaling occurs. Durations is displayed in nanoseconds, and ips counts is displayed without units.
-
:before_scenario/after_scenario/before_each/after_each- we won’t get into those too much here but if you need to do something before/after your benchmarking function without it being measured refer to Benchee’s hooks section
Inputs
It’s important to benchmark your functions with data that reflects what that function might actually operate on in the real world.
Frequently a function can behave differently on small sets of data versus large sets of data! This is where Benchee’s inputs configuration option comes in.
This allows you to test the same function but with as many different inputs as you like, and then you can see the results of the benchmark with each of those functions.
So, let’s look at our original example again:
list = Enum.to_list(1..10_000)
map_fun = fn i -> [i, i * i] end

Benchee.run(%{
  "flat_map"    => fn -> Enum.flat_map(list, map_fun) end,
  "map.flatten" => fn -> list |> Enum.map(map_fun) |> List.flatten() end
})
In that example we’re only using a single list of the integers from 1 to 10,000. Let’s update that to use a couple different inputs so we can see what happens with smaller and larger lists. So, open that file, and we’re going to change it to look like this:
map_fun = fn i -> [i, i * i] end

inputs = %{
  "small list" => Enum.to_list(1..100),
  "medium list" => Enum.to_list(1..10_000),
  "large list" => Enum.to_list(1..1_000_000)
}

Benchee.run(
  %{
    "flat_map" => fn list -> Enum.flat_map(list, map_fun) end,
    "map.flatten" => fn list -> list |> Enum.map(map_fun) |> List.flatten() end
  },
  inputs: inputs
)
You’ll notice two differences.
First, we now have an inputs map that contains the information for our inputs to our functions.
We’re passing that inputs map as a configuration option to Benchee.run/2.
And since our functions need to take an argument now, we need to update our benchmark functions to accept an argument, so instead of:
fn -> Enum.flat_map(list, map_fun) endwe now have:
fn list -> Enum.flat_map(list, map_fun) endLet’s run this again using:
mix run benchmark.exsNow you should see output in your console like this:
Operating System: Linux
CPU Information: Intel(R) Core(TM) i7-4790 CPU @ 3.60GHz
Number of Available Cores: 8
Available memory: 15.61 GB
Elixir 1.8.1
Erlang 21.3.2

Benchmark suite executing with the following configuration:
warmup: 2 s
time: 5 s
memory time: 0 ns
parallel: 1
inputs: large list, medium list, small list
Estimated total run time: 42 s

Benchmarking flat_map with input large list...
Benchmarking flat_map with input medium list...
Benchmarking flat_map with input small list...
Benchmarking map.flatten with input large list...
Benchmarking map.flatten with input medium list...
Benchmarking map.flatten with input small list...

##### With input large list #####
Name                  ips        average  deviation         median         99th %
flat_map            13.20       75.78 ms    ±25.15%       71.89 ms      113.61 ms
map.flatten         10.48       95.44 ms    ±19.26%       96.79 ms      134.43 ms

Comparison:
flat_map            13.20
map.flatten         10.48 - 1.26x slower +19.67 ms

##### With input medium list #####
Name                  ips        average  deviation         median         99th %
flat_map           2.66 K      376.04 μs    ±23.72%      347.29 μs      678.17 μs
map.flatten        1.75 K      573.01 μs    ±27.12%      512.48 μs     1076.27 μs

Comparison:
flat_map           2.66 K
map.flatten        1.75 K - 1.52x slower +196.98 μs

##### With input small list #####
Name                  ips        average  deviation         median         99th %
flat_map         266.52 K        3.75 μs   ±254.26%        3.47 μs        7.29 μs
map.flatten      178.18 K        5.61 μs   ±196.80%        5.00 μs       10.87 μs

Comparison:
flat_map         266.52 K
map.flatten      178.18 K - 1.50x slower +1.86 μs
We can now see information for our benchmarks, grouped by input. This simple example doesn’t provide any mind blowing insights, but you’d be surprised how much performance varies based on input size!
Formatters
The console output that we’ve seen is a helpful beginning for measuring the runtimes of your functions, but it’s not your only option! In this section we’ll look briefly at the three other available formatters, and also touch on what you’d need to do to write your formatter if you like.
Other formatters
Benchee has a console formatter built in, which is what we’ve seen already, but there are three other officially supported formatters -
benchee_csv,
benchee_json and
benchee_html.
Each of them does exactly what you would expect, which is writing the results to the named file formats so you can work with your results further in whichever format you like.
Each of these formatters is a separate package, so to use them you need to add them as dependencies to your mix.exs file like so:
defp deps do
  [
    {:benchee_csv, "~> 1.0", only: :dev},
    {:benchee_json, "~> 1.0", only: :dev},
    {:benchee_html, "~> 1.0", only: :dev}
  ]
end
While benchee_json and benchee_csv are simple, benchee_html is actually very full featured!
It can help you produce nice graphs and charts from your results easily, and you can even export them as PNG images.
You check out an example html report if you’re interested, it includes graphs like this one:
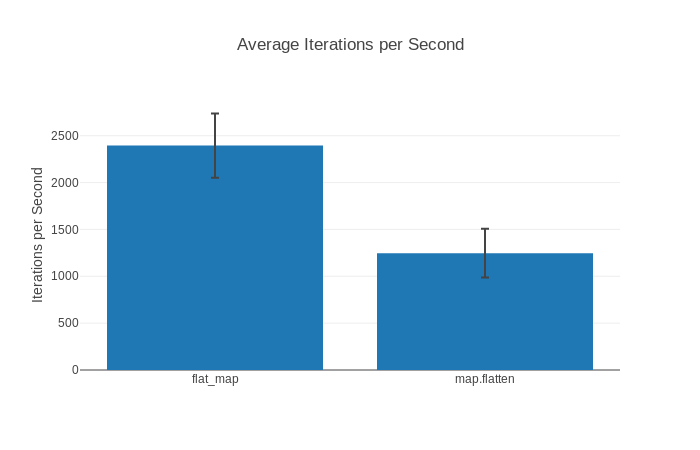
All three formatters are well-documented on their respective GitHub pages, so we won’t cover the details of them here.
Custom formatters
If the four offered formatters aren’t enough for you, you can also write custom formatter.
Writing a formatter is pretty easy.
You need to write a function that accepts a %Benchee.Suite{} struct, and from that you can pull whatever information you like.
Information about what exactly is in this struct can be found on GitHub or HexDocs.
The codebase is well-documented and easy to read if you’d like to see what sorts of information could be available for writing custom formatters.
You could also write a more full featured formatter that adopts the Benchee.Formatter behaviour we’ll stick with the simpler function version here.
For now, we’ll show a quick example of what a custom formatter might look like below as an example of how easy it is. Let’s say we just want an extremely minimal formatter that prints the average run time for each scenario - this is what that might look like:
defmodule Custom.Formatter do
  def output(suite) do
    suite
    |> format
    |> IO.write()

    suite
  end

  defp format(suite) do
    Enum.map_join(suite.scenarios, "\n", fn scenario ->
      "Average for #{scenario.job_name}: #{scenario.run_time_data.statistics.average}"
    end)
  end
end
And then we could run our benchmark like this:
list = Enum.to_list(1..10_000)
map_fun = fn i -> [i, i * i] end

Benchee.run(
  %{
    "flat_map" => fn -> Enum.flat_map(list, map_fun) end,
    "map.flatten" => fn -> list |> Enum.map(map_fun) |> List.flatten() end
  },
  formatters: [&Custom.Formatter.output/1]
)
And when we run now with our custom formatter, we would see:
Operating System: Linux
CPU Information: Intel(R) Core(TM) i7-4790 CPU @ 3.60GHz
Number of Available Cores: 8
Available memory: 15.61 GB
Elixir 1.8.1
Erlang 21.3.2

Benchmark suite executing with the following configuration:
warmup: 2 s
time: 5 s
memory time: 0 ns
parallel: 1
inputs: none specified
Estimated total run time: 14 s

Benchmarking flat_map...
Benchmarking map.flatten...
Average for flat_map: 419433.3593474056
Average for map.flatten: 788524.9366408596
Memory
We’re almost all the way to the end, but we’ve gone all this way without showing you one of Benchee’s coolest features: memory measurements!
Benchee is able to measure memory consumption, it is limited to the process your benchmark is executed in though. It can’t currently track memory consumption in other processes (like worker pools).
Memory consumption includes all the memory your benchmarking scenario used - also the memory that was garbage collected so it does not necessarily represent the maximum process memory size.
How do you use it? Well you just use the :memory_time option!
Operating System: Linux
CPU Information: Intel(R) Core(TM) i7-4790 CPU @ 3.60GHz
Number of Available Cores: 8
Available memory: 15.61 GB
Elixir 1.8.1
Erlang 21.3.2

Benchmark suite executing with the following configuration:
warmup: 0 ns
time: 0 ns
memory time: 1 s
parallel: 1
inputs: none specified
Estimated total run time: 2 s

Benchmarking flat_map...
Benchmarking map.flatten...

Memory usage statistics:

Name           Memory usage
flat_map          624.97 KB
map.flatten       781.25 KB - 1.25x memory usage +156.28 KB

**All measurements for memory usage were the same**
As you can see, Benchee doesn’t bother displaying all the statistics as all samples taken were the same. This is actually quite common if your functions don’t include an amount of randomness. And what good would all the statistics be if they just told you the same number all the time?
Caught a mistake or want to contribute to the lesson? Edit this lesson on GitHub!